
Cardano (ADA) is moving in an upward direction as the general conditions in the crypto market have turned from bearish to bullish. According to CoinMarketCap, the ADA price has shown stability over the last 24 hours but remains up by 1.97% over the last week.
At the time of writing, ADA is trading at $0.2609, with a trading volume of $713.78 million, which has declined by 3.41% over the last 24 hours. However, its market capitalization stands at $9.43 billion, which is stable.

Source: CoinMarketCap
Also Read: Cardano (ADA) Eyes Beakout: Consolidation Hints at Major Move Above $35
Furthermore, the crypto analyst Ali Charts highlighted that ADA is once again approaching a key historical support zone that previously triggered strong upside reactions.
This level has acted as a major reversal area in past cycles, producing notable rebounds of around 85% and even 200%, making it a closely watched region among technical traders tracking long-term market structure.
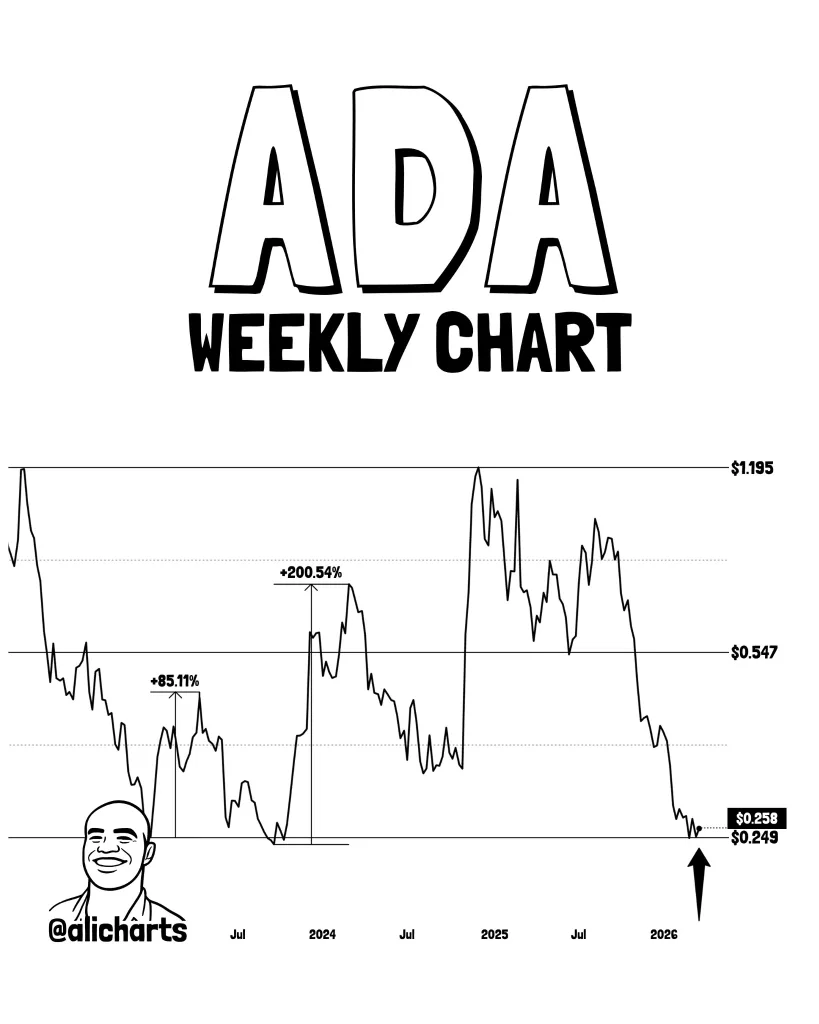
Source: Ali Charts’ X Post
In the event that there is growing participation from the buyers’ side, it might signal that they are continuing their buying action, which would be seen as bullish sentiment.
In that regard, the immediate upside target for this coin would stand at around $0.547, while the next major resistance level would be in the region of $1.195.
According to TradingView, ADA shows signs of recovery after hitting its lowest point around $0.234 in mid-April.
The token is currently trading at the $0.260 level, which has resulted in an array of higher lows, indicating a positive turn in the market trend. The current bull run comes after a period of significant consolidation.

Source: TradingView
This strength is further substantiated by the technical indicators. The RSI is currently standing at 59.01, which implies that there is plenty of room left for the RSI to move up before it hits the overbought level.
At the same time, the MACD has successfully crossed above the signal line, turning the histogram into positive green bars.
This article contains market analysis and price predictions. These are not guarantees. Crypto markets are volatile. Always DYOR. Not financial advice.
Also Read: Cardano (ADA) Near Critical Support — Is a Drop to $0.10 Coming Next?

