
Cardano has managed to hold above the critical $0.25 support level on March 09. Analysts were waiting to see if the asset would attempt to recover towards the $0.30 resistance zone. This comes at a time when the crypto market is recovering from recent market volatility.
According to market data from CoinGecko, Cardano was trading around $0.2575 at the time of writing, reflecting a 2.21% increase over the past 24 hours. It has managed to achieve $773 million in daily volume. At the same time, it has maintained a market capitalization of approximately $9.29 billion, representing approximately 0.40% of the total crypto market.

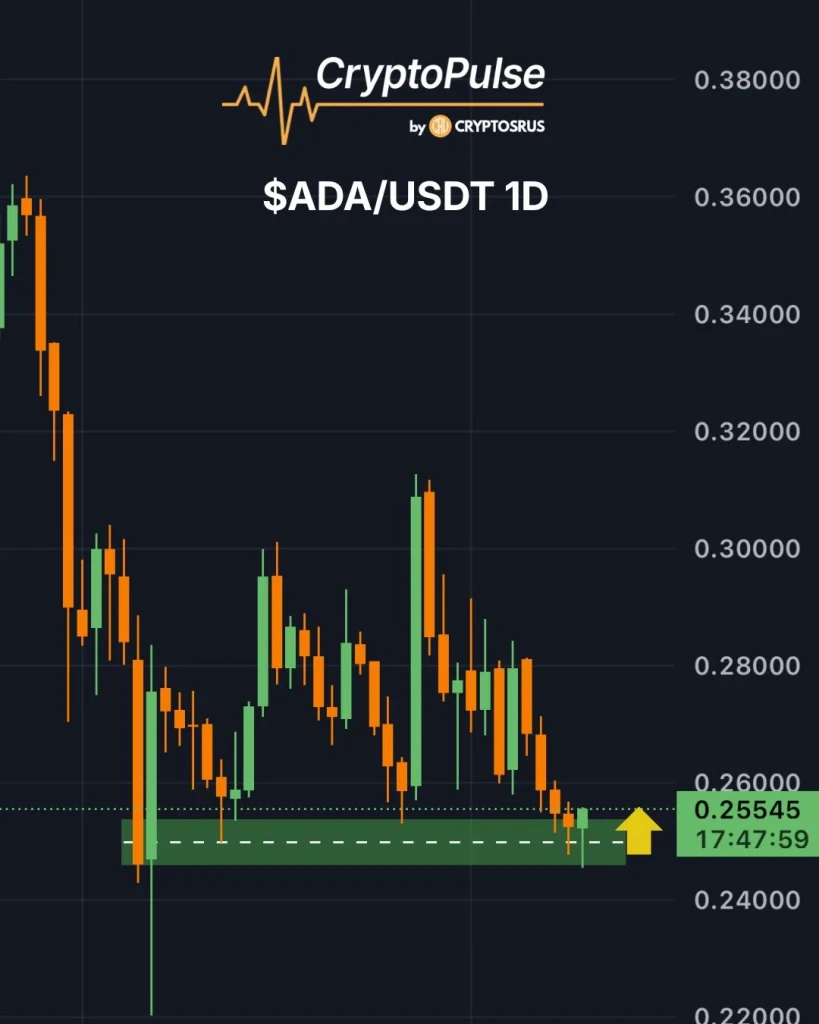
In recent post by analyst CryptoPulse, highlighted that Cardano is holding near the $0.25 demand zone, a level that has previously acted as strong support. Market watchers say that if buyers manage to keep the price above this area, ADA could attempt a short-term rebound. In such a case, the token may climb toward the $0.28–$0.30 range, where the next resistance levels appear.
Cardano is currently trying to break above the $0.30 to $0.31 resistance zone. However, it is still trading within the descending channel. However, the price is still moving inside a descending channel, which indicates that the broader price structure has not fully shifted upward yet. It is worth noting that the $0.30 region has previously been a support region but is now a resistance region.
Also Read | CRV Holds $0.20 Support as Momentum Signals Possible Rebound to $0.50
Some technical indicators show slight improvement. The Relative Strength Index (RSI), for example, has risen back over the 50 level, which is an indication that the buying pressure is increasing. Further, the price action is showing higher lows, and the market may be trying to recover from the previous drop.
Even with these signals, the overall trend is still bearish because the lower highs are still intact. Analysts are saying that for the market to start recovering, there are certain confirmations that need to happen. Among these are the daily close above the $0.31 level, breaking through the descending trendline, and staying above the 20-day simple moving average (SMA).
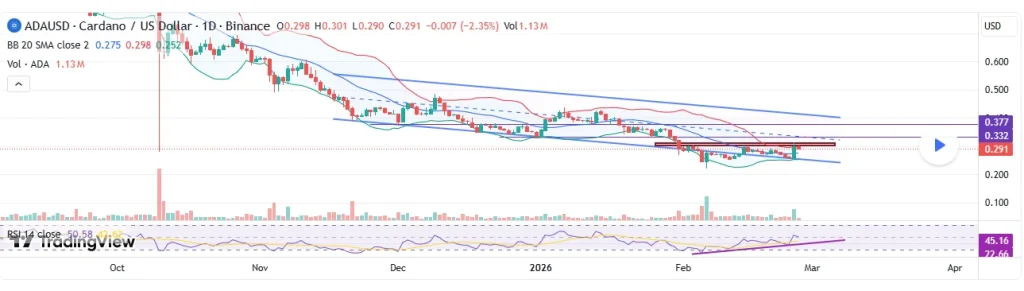
Once these are accomplished, the market could start targeting higher price levels such as $0.332 and eventually $0.377. These are the price levels that could indicate that the buyers are firmly back in control of the market.
However, there is also the possibility that the market could start pulling back again. If the price fails to break through the resistance at the $0.30 level, the price could once again fall back down to the $0.27 level. Further declines could push the price down towards the $0.24 level, which is the lower boundary of the descending channel.
For now, the price action is still an early sign of a breakout rather than a reversal of the trend. Analysts are saying that the market is still trying to see if the price can break through the daily close resistance level.
Also Read | SEI Tests Key Channel Support With $0.157 Target in Focus

