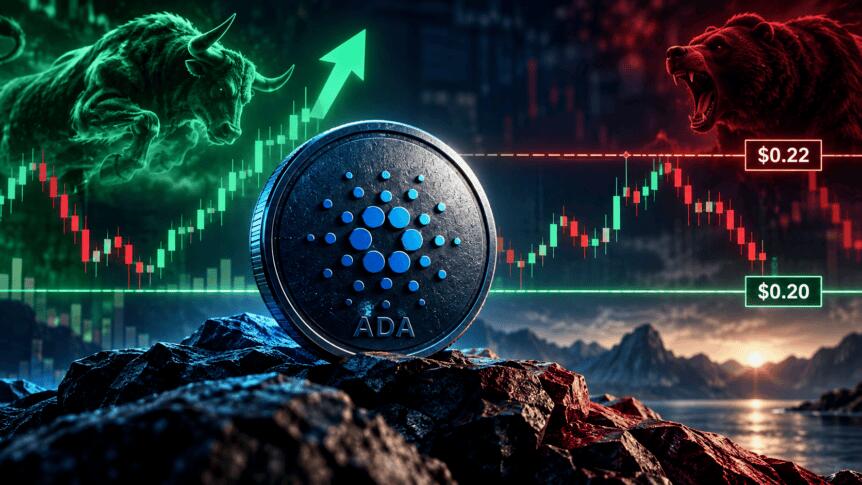
Cardano is at an important point right now. The ADA price pushed above $0.22, reached $0.22303, and then quickly gave back the move. That rejection has put the bullish setup from the previous 4-hour chart under pressure.
For now, two levels matter most: $0.22 on the upside and $0.20 on the downside.
The ADA chart was checked, and there is a strong push by buyers to break the resistance level of $0.22. In the 4-hour chart, ADA moved from about $0.16 to $0.22303. The current candle started at $0.22155, moved to $0.22303, fell to $0.21742, and is now trading at $0.218. This has formed a very clear rejection at the resistance level of $0.22045. ADA is also below the 9 EMA at $0.21964.
RSI has the same story to tell. The 4-hour RSI dropped from 53.62 to 49.95 to come back below the 50 mark. Thus, in order for buyers to get back in control, ADA must rise above $0.22045 and then cross $0.22303.
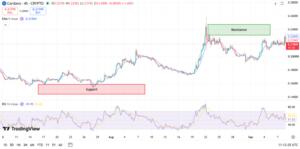
In a post on X, the 4-hour setup shows an inverted head-and-shoulders pattern. The head formed around $0.10-$0.12, while the right shoulder developed around $0.16-$0.18. The neckline was around $0.22.
$ADA printing a textbook inverted head & shoulders
— Crypto With Gopal (@cryptowithgopal) September 9, 2026
The right shoulder is holding strong, with buyers defending the neckline around $0.22. Momentum is shifting bullish as price pushes into resistance
A clean breakout above the neckline could open the path toward the… pic.twitter.com/8dH7uBqY67
That pattern gave bulls a potential measured target near $0.34. The calculation is straightforward: the distance from the $0.10 head to the $0.22 neckline is about $0.12. Adding that distance to $0.22 gives roughly $0.34.
But there is an important condition here. ADA needs to hold above the $0.22 neckline for that target to remain valid. The rejection toward $0.218 means the breakout has not been confirmed yet.
The daily chart makes the $0.22 area even more important. ADA is trading around $0.2186, almost exactly at the marked resistance of $0.21861. This level has rejected price during previous attempts in May-June and August 2026.
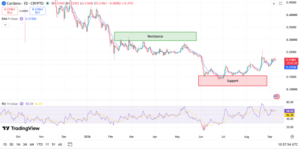
There are still some positive readings. ADA is above the daily 9 EMA at $0.21556, and RSI has climbed to 58.54 from 56.25. RSI is also below 70, so the market is not yet in overbought territory.
The bigger trend, however, remains bearish because ADA is still below the major descending resistance line. A daily close above $0.2186-$0.22 would therefore be much more important than a brief move above the level.
The Glassnode data also puts the $0.20 level firmly on the radar. The data shows ADA’s market cap moving between roughly $7.4 billion and $8.4 billion as the ADA price moved between $0.20 and $0.22. That’s about a $1 billion difference in market capitalization across a $0.02 price range.
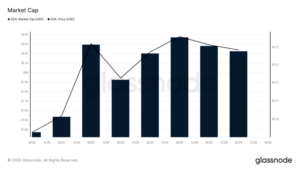
For ADA, $0.20 is now the key support. In case of a defense of this level, the price may stay in the range of $0.20-$0.22 and try to resist once again. The breakdown of $0.20 will bring $0.18-$0.16 back into consideration. In case ADA manages to break through $0.22 and settle above it, the next levels to target will be $0.24-$0.26, $0.30 and possibly even $0.34.
Now, the price of ADA is stuck between the resistance and support levels. A confirmed breakout above $0.22 will boost the bulls’ hopes, while the breakdown of $0.20 will weaken them considerably.
This article was originally published as Cardano Price Faces Key Test At $0.22 After Failed Breakout on Crypto Breaking News – your trusted source for crypto news, Bitcoin news, and blockchain updates.





