
Cardano is testing a key resistance level near $0.28 after rising nearly 5% in the past 24 hours, according to TradingView data. The move comes as analysts identify a potential breakout from a descending channel that could send ADA toward the $0.33 level.
A successful breakout for Cardano will likely shift the near-term move toward a more bullish view and may allow investors to continue to hold their positions.
Traders will be watching closely to see if the asset will be able to overcome the long-running downtrend pattern that has limited its higher price move since the start of the year.
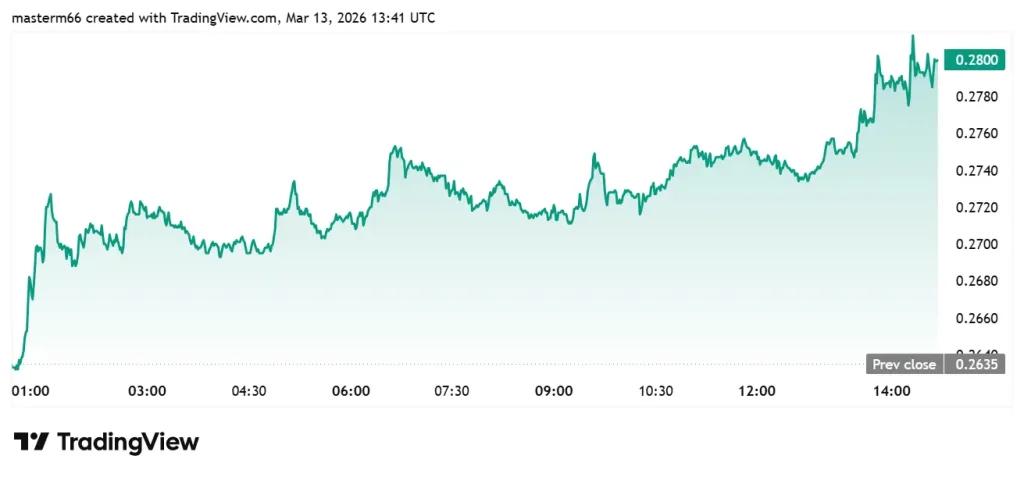
Source: TradingView
Crypto analyst Profit Demon highlighted the possibility of a breakout to $0.33 in a March 13 post on social media platform X. The analyst stated that ADA is testing the top side of a descending channel formation on the 1-day chart.
The analyst provided a chart to support his claim. The chart illustrates how ADA has traded inside the downward-sloping channel since the overall market correction in the first part of the year. The most recent price action illustrated ADA attempting to reclaim the bottom side of the channel, with the asset rapidly approaching the trendline resistance.
If ADA is able to break out of the channel, the analyst suggested the breakout will likely prompt a larger upward move for the cryptocurrency. Once the trendline resistance is broken, the chart illustrates possible price targets to be $0.33, $0.43, $0.52, or even $0.68.
However, the breakout will need to be backed by sustainable buying interest and stronger momentum indicators to invalidate any possible downtrend.
Also Read | Cardano (ADA) Trades Near $0.26 as Market Activity Slows
As ADA approaches resistance, the TradingView chart illustrates that momentum indicators suggest growing bullish interest. Currently, the Relative Strength Index (RSI) is at 68, which is very close to the overbought threshold of 70.
When the RSI reaches this point, it often represents growing bullish momentum. However, there’s some room for additional upside if the bulls continue to add to their positions. Also, the chart illustrated that ADA is trading very close to the 200-period Exponential Moving Average (EMA) at $0.278.
By reclaiming this level, it would significantly bolster the case for a breakout attempt. Breaking decisively above the 200 EMA would represent improving market conditions and potentially attract additional buying interest.
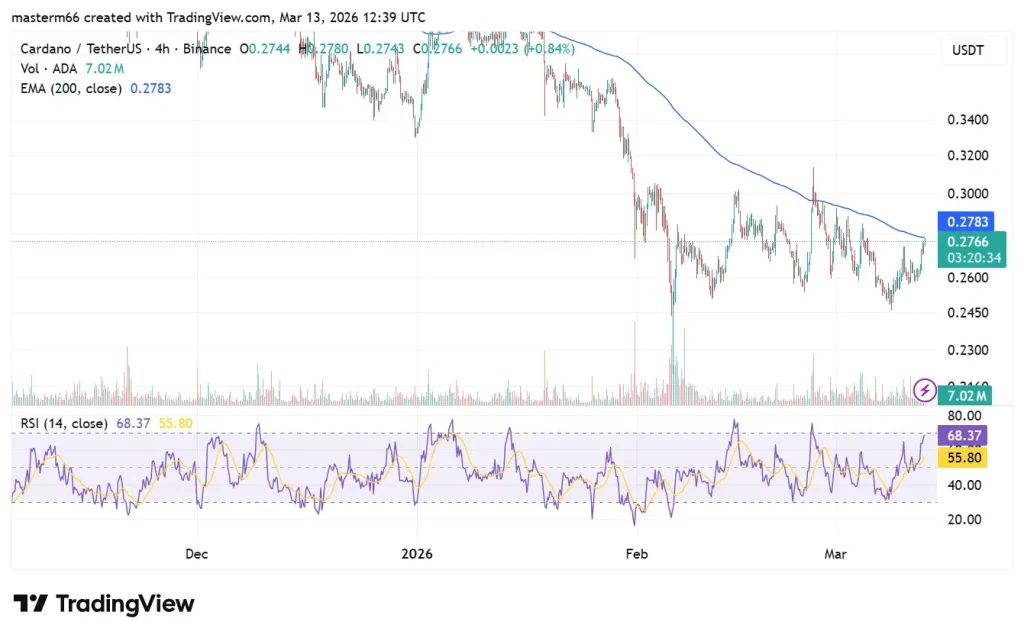
Source: TradingView
Additionally, the on-chain and derivatives data illustrate increased interest in the Cardano network. According to DefiLlama, the network’s Total Value Locked (TVL) is at approximately $146.9 million, following a 3.7% increase in the last 24 hours.
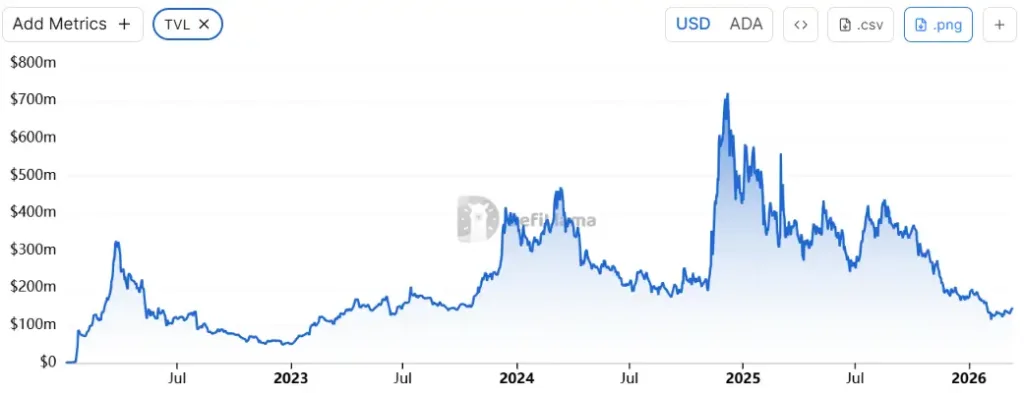
Source: DefiLlama
Increased TVL indicates modest increases in capital being committed to Cardano-based DeFi applications. Also, CoinGlass shows that the number of Cardano derivative participants is increasing.
The 24-hour trading volume of ADA Futures rose to approximately $777 million, while open interest also increased to approximately $461 million. Increased derivatives activity indicates that traders are positioning themselves in anticipation of potential volatility.
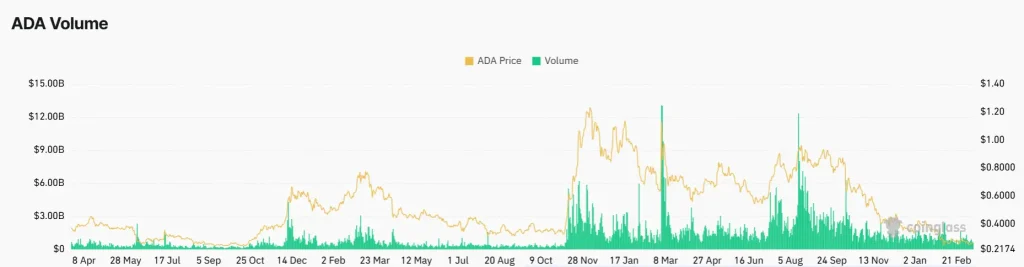
Source: CoinGlass
If Cardano fails to break above the descending channel resistance, the price may remain within the channel for an extended period. Traders will need to monitor the $0.26-$0.27 support zone if the price does not break above the channel.
A break above the long-running downtrend line and channel resistance ($0.28) by Cardano could be a sign of a change in momentum direction and could provide the path to reach the $0.33 level.
This article contains market analysis and price predictions. These are not guarantees. Crypto markets are volatile. Always DYOR. Not financial advice.
Also Read | Cardano (ADA) Whales Dump 130M ADA: Shocking Market Signal

