
Cardano saw whales accumulate 220 million ADA over the past week, signaling renewed interest from large holders in the cryptocurrency market.
According to crypto analyst Ali Charts, as of Tuesday, March 31, this accumulation phase signals rising confidence in Cardano and its long-term potential.
It also suggests strategic investor positioning ahead of potential volatility and broader market sentiment shifts across the digital asset ecosystem.
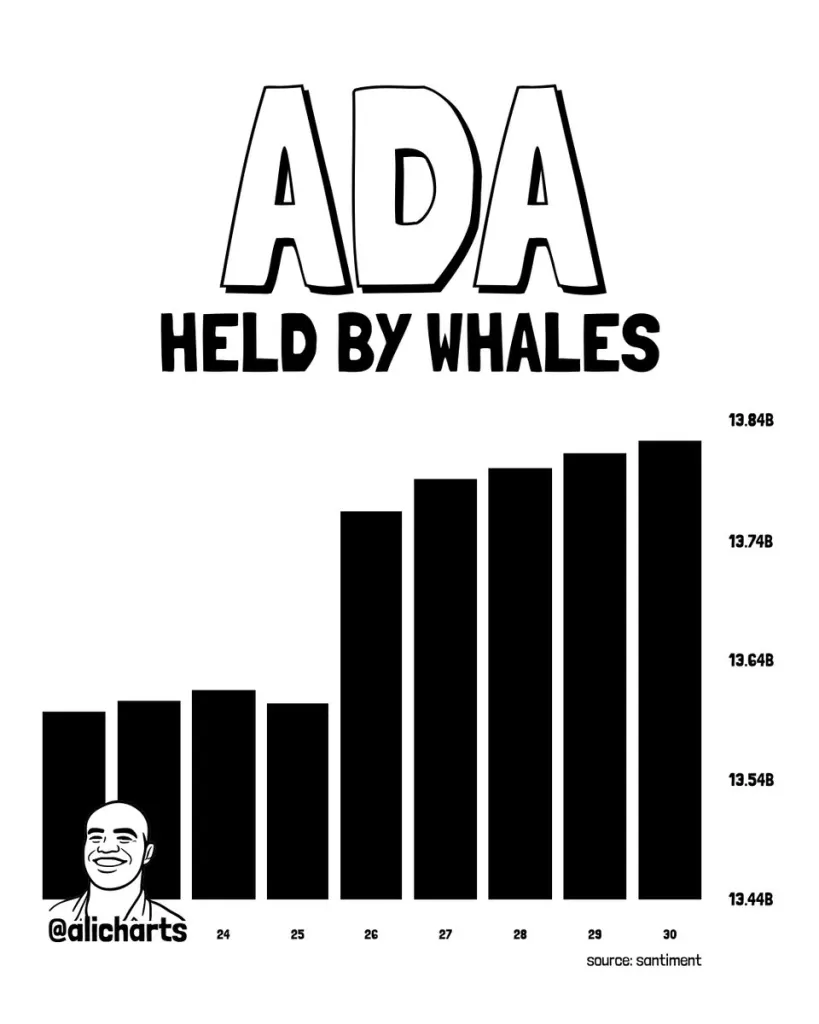
Source: Ali Charts’ X Post
Ali Charts suggests that the ongoing whale accumulation may be a result of ongoing conviction in Cardano fundamentals, which could boost support levels. However, volatility levels remain high.
Moreover, such on-chain data does not necessarily translate to price appreciation. Traders are looking at other market structures, volume levels, and macroeconomic factors for further guidance in the market outlook.
Also Read: Cardano (ADA) Breaks Short-Term Channel, Eyes Critical $0.22 Support Zone
After this whale accumulation, Cardano is once again gaining increased market interest as it continues to be discussed within regulatory and market circles as a potential commodity-like asset.
According to crypto analyst Crypto Patel, despite being down nearly 90% from its highs, traders point to a long-term accumulation range and improving higher time frame structure, implying that long-term investors may be accumulating early for a potential macro reversal phase that is developing behind the scenes.
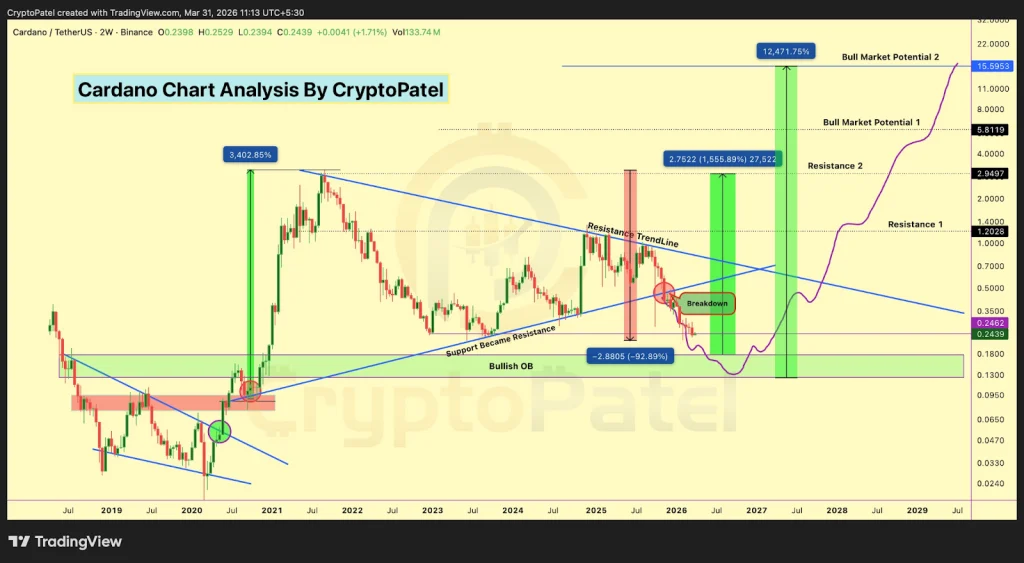
Source: Crypto Patel’s X Post
The outlook for ADA is highly speculative and is accompanied by bullish projections being shared throughout the market. The levels are being referenced by analysts and traders alike for possible cycle-based price targets such as $1, $3, $5, and $10+.
While these levels are not confirmed, they are a reflection of the growing bullish sentiment based on historical bull market expansion cycles.
According to TradingView, the RSI indicator is sitting at 40.54. This means ADA is currently in a bearish to neutral zone.
It is above the oversold zone of 30, yet the bearish trend is a cause for worry as selling pressure is likely to continue. The line is struggling to hold up above the signal line as a result of a lack of conviction in the market.
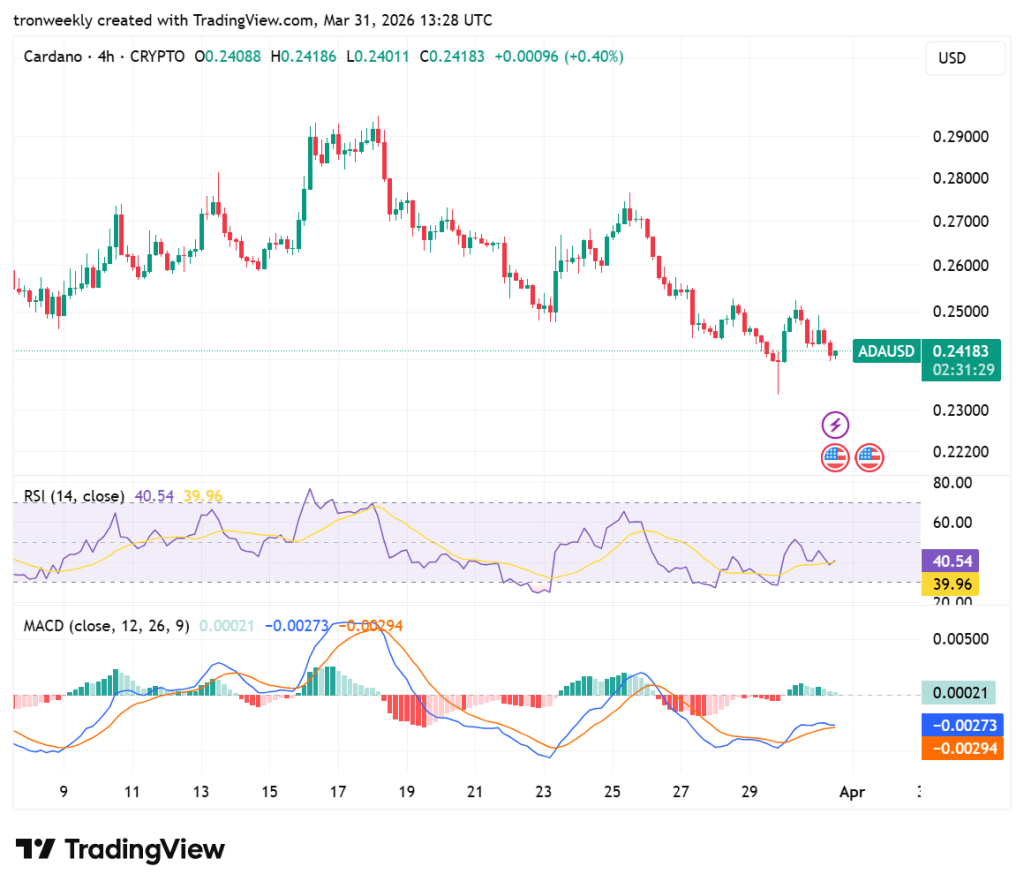
Source: TradingView
The MACD line is showing a weak bullish crossover, but both lines are still very low compared to the zero level. This implies that although a weak recovery process is taking place, the overall market trend is still very bearish.
The size of the histogram bars is very small and pale green in color, which implies that the current purchasing power is not sufficient to cause a reversal in the prices.
This article contains market analysis and price predictions. These are not guarantees. Crypto markets are volatile. Always DYOR. Not financial advice.
Also Read: Cardano Price Prediction: Will ADA Reach $0.30 After Holding Support?


