
Celestia (TIA) is trading with a weaker tone after focus shifted to a key support area. The trend is soft throughout the session. Pressure was seen at the lower boundary. The overall structure is controlled with traders monitoring reactions along the range floor.
As of writing, on Tuesday, March 3, the token is trading at $0.3191 after experiencing a 6.06% loss in a day. However, the trading volume is up by 6.7% to $34.11 million. The token still managed to hold onto its gains of 6.25% over the past week, according to CoinMarketCap data.

Source: CoinMarketCap
Alpha Crypto Signal, an analyst, highlighted that TIA is still trading within a horizontal channel on the 4-hour chart. The cryptocurrency is reacting to the range boundaries. The token is rotating towards the support zone of $0.30 to $0.29. This zone has shown consistent buying interest.
The analyst described the market bias as range-bound. The view favors long positions near support, with a strict invalidation point below the low of the channel. The first target remains the center of the range. While a move towards the high range would require increased momentum.
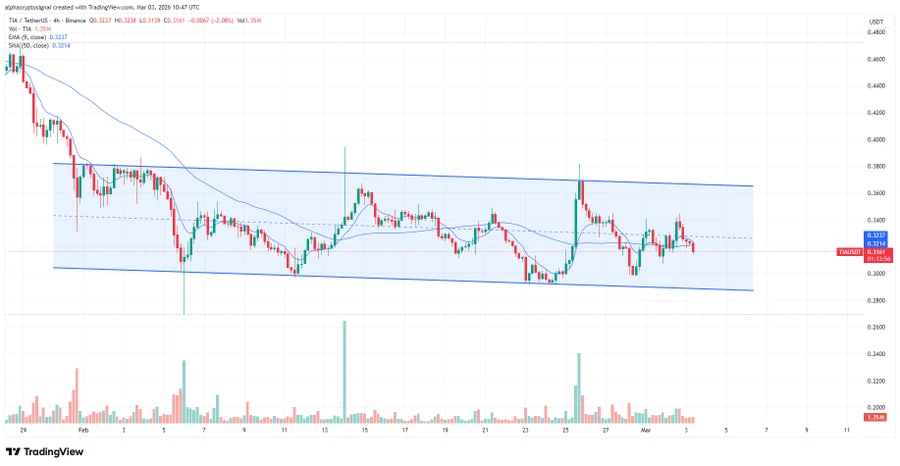
Source: X
According to CoinGlass data, the future volume is $79.62 million after a decline of 6.08%. The open interest decreased by 6.77% to $45.87 million.
The funding rates remained mildly negative. The OI-weighted funding rate stood at -0.0083%. This indicates that the market is under pressure from short positions.

Source: CoinGlass
Also Read: IOTA Price Outlook: $0.0699 Short-Term TARGET After Support Hold
TIA is trading below all exponential moving averages on the daily chart. The 20-day EMA is trading at $0.3326. The 50-day EMA is at $0.3873. These levels continued to represent resistance on the price action.
The 100-day EMA stands at $0.5284. This is also an indication of the declining trend. The 200-day EMA sits at $0.9364. This is a sign of the declining trend.
Momentum indicators also indicate low strength levels. The Relative Strength Index (RSI) reads at 43.33. Its signal line is at 41.20. Both are indicating a neutral bias and limited buyer conviction.
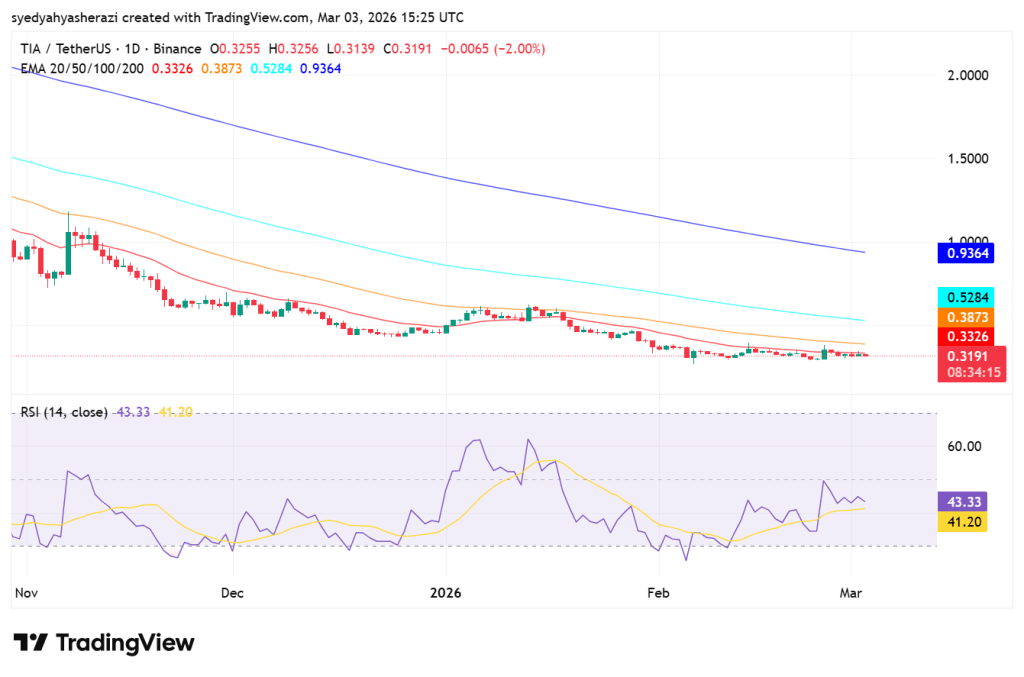
Source: TradingView
The traders are monitoring the price action on the chart as the price is approaching the lower boundary. The structure does not indicate any significant break. Reactions at support levels will dictate the next move. For the time being, the market is neutral.
Also Read: Celestia (TIA) Defends $0.30 Support, Hinting at a Potential $0.55 Move

