
Celestia (TIA) shows mixed market movement across short-term frames, as of 23 April 2026. The token records a 7.35% decline over the past 24 hours while maintaining active participation in trading sessions.
Weekly performance reflects a 1.26% decline, highlighting ongoing volatility across the broader trend structure. According to CoinMarketCap data, the token is trading at $0.3567 with strong market engagement.

The 24-hour trading volume stands at $30.43Million, indicating stable liquidity conditions. Market capitalization is valued at $323.99Million, showing a 7.94% decline during the same period.
Also Read: Celestia (TIA) Breaks Key Resistance as Price Targets a Breakout to $0.70
The token is trading inside a long-term descending channel, showing sustained bearish pressure since the highs near the $8.00 resistance zone.
The price currently sits around $0.35, below the MA50 near $0.41. Key support is $0.26, while resistance levels include $0.40, $0.60, and $0.75, and $1.00 breakout zone potential upside move expected.
According to the crypto analyst Jonathan Carter, the token is still confined in the lower channel, yet a break above the MA50 line may lead to the onset of the upward trend. The first target price level is at $0.40, followed by $0.60, $0.75, and $1.00.

Significant resistance levels upon bullish momentum extension are at $1.33, $1.70, $2.35, $3.00, $3.90, $5.00, $5.75, $6.50, and $8.00 resistance zone on breakout confirmation volume surge.
TIA stays bearish as long as it trades below the descending resistance level. The inability to maintain above $0.35 could result in TIA sliding to its next support area at $0.26.
Further breakdown could see targets of $0.19 and $0.15. Technical analysis favors bulls when the MA50 is regained, and $0.60 is broken with sufficient volume support.
From an indicator perspective, the Relative Strength Index (14) on the weekly timeframe displays poor momentum, trading at 34.54 with its signal line around 30.07.
The current position is still below the neutral point of 50, suggesting that there is persistent bearish momentum. Nonetheless, the slightly bullish curve signifies efforts to recover.
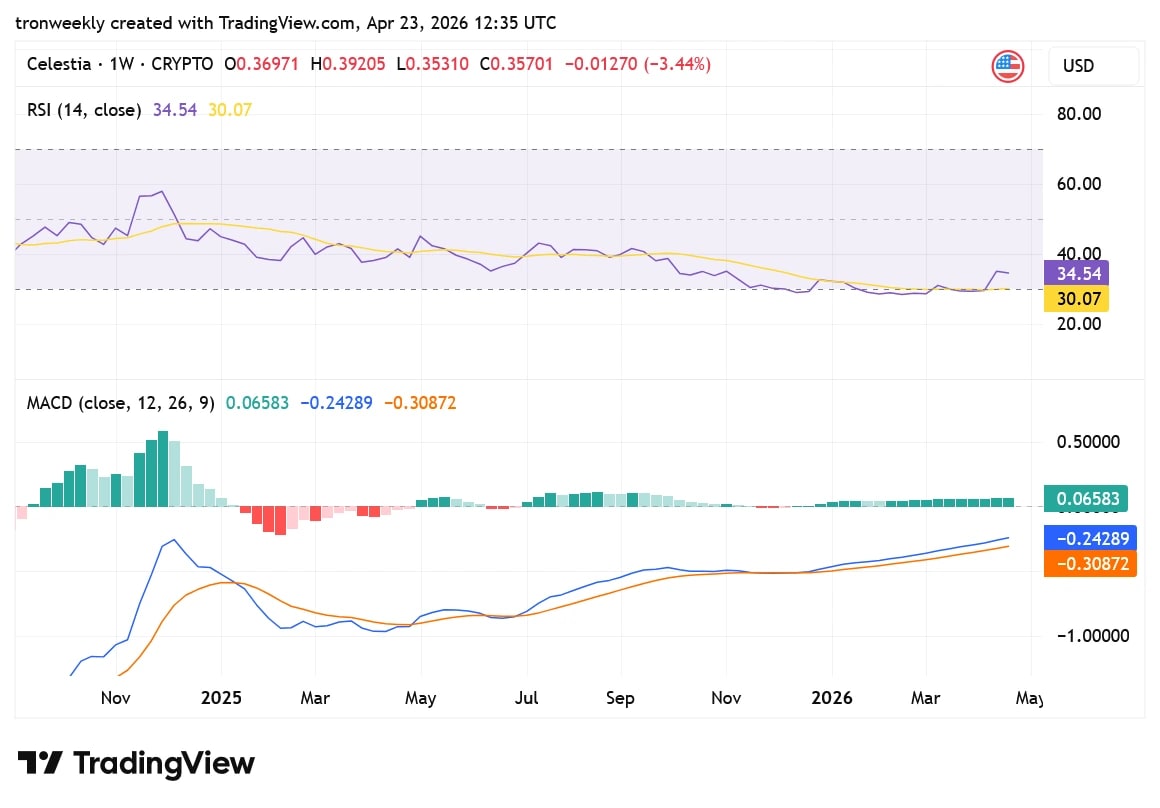
The MACD is showing early signs of a bullish recovery as it has started showing signs of a positive value at 0.06583.
Since the MACD value is less than the signal line value of -0.30872 (-0.24289), this indicates that there is weakness in the bearish momentum.
This article contains market analysis and price predictions. These are not guarantees. Crypto markets are volatile. Always DYOR. Not financial advice.
Also Read: Celestia (TIA) Shows Early Signs of Breakout With a $1.2 Recovery in Sight

