
Chainlink (LINK) maintained its stability as other crypto assets struggled with uncertain market conditions. The asset is resting on a key support area, moving within a tight range. Analysts pointed out that this kind of movement is usually a precursor to a better movement.
As of press time, on Monday, LINK is trading at $8.70, marking a 0.68% increase in a day. The trading volume is showing a strong bullish surge, up 48.16%, and is currently standing at $636.29 million. Over the last week, the LINK coin price has gone up by 0.71%, according to CoinMarketCap.
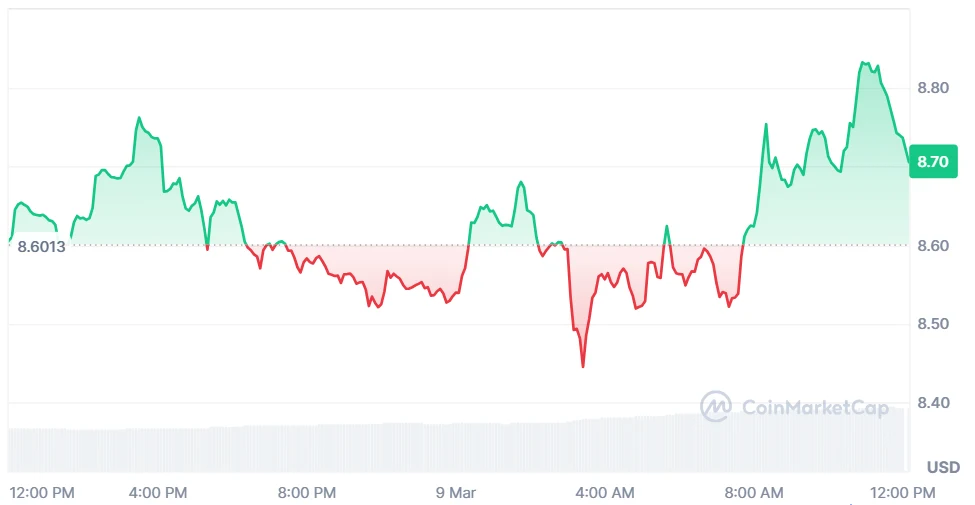
Source: CoinMarketCap
CryptoPulse, an analyst, highlighted that LINK is currently testing support of the channel. If this level holds, it may attempt a move towards $9.50. If it breaks the pattern, it could weaken the trend.
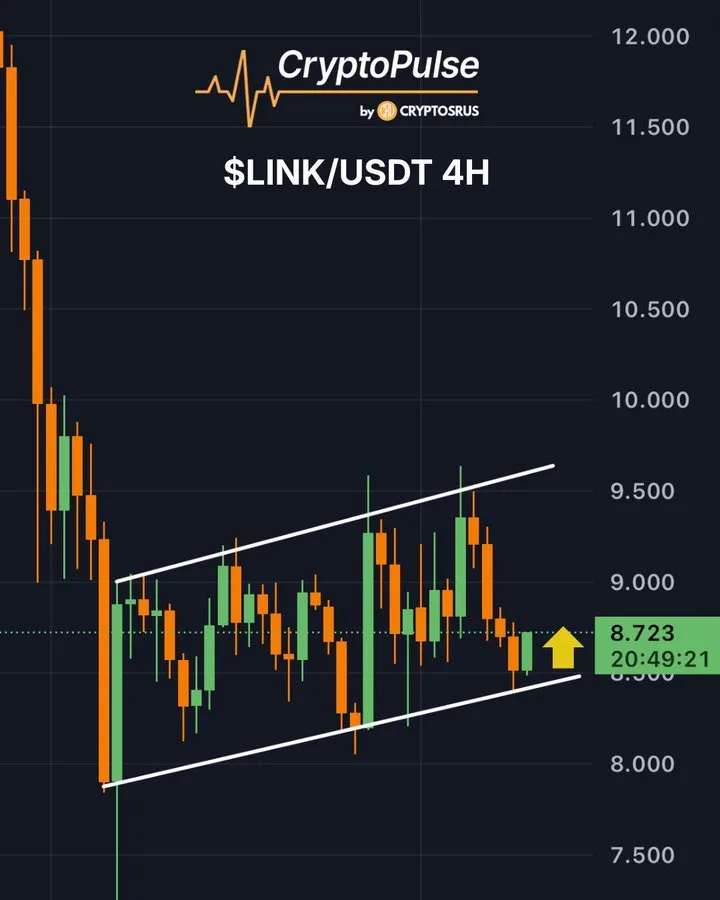
Source: X
Moreover, another analyst, CryptoWZRD, mentioned that the LINK price has closed without any directional bias. The price is trading in a tight range.
The overall picture showed that a retest of the $8.20 level has bullish implications. A rise in the price towards the $9.20 level is expected if the level holds as support.
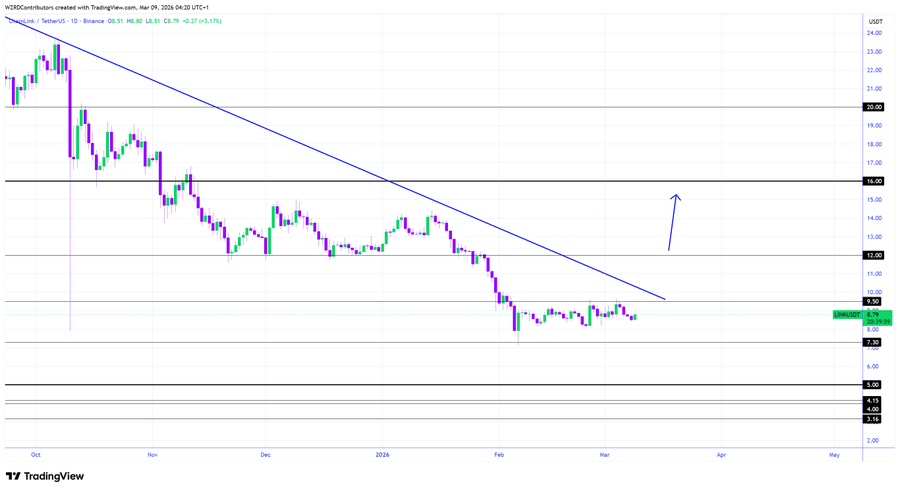
Source: X
Also Read: SEI Tests Key Channel Support With $0.157 Target in Focus
Capital inflows also provided support to LINK’s outlook. SoSoValue data shows a capital inflow of $935,000 on March 6. The day before, there was an inflow of $1.93 million. The total capital inflow is $90.66 million. The figures show that there is continued interest in the cryptocurrency.

Source: SoSoValue
These inflows were recorded at a time when many altcoins were experiencing lower activity. This shows that investors are still investing in Chainlink-related assets.
The Relative Strength Index (RSI) is at 45.39, whereas the RSI-based signal line stands at 45.55. The figures show that the token is in a neutral position. The readings do not show strong selling or buying pressures. The current values indicate balanced activity and a stable short-term trend.

Source: TradingView
The Moving Average Convergence Divergence (MACD) line reads at -0.198, and the signal line is at -0.256. The histogram recorded at 0.058. This indicates a slight positive move and a decline in bearish pressures.
Also Read: CRV Holds $0.20 Support as Momentum Signals Possible Rebound to $0.50
Chainlink (LINK) maintained its stability as other crypto assets struggled with uncertain market conditions. The asset is resting on a key support area, moving within a tight range. Analysts pointed out that this kind of movement is usually a precursor to a better movement.
As of press time, on Monday, LINK is trading at $8.70, marking a 0.68% increase in a day. The trading volume is showing a strong bullish surge, up 48.16%, and is currently standing at $636.29 million. Over the last week, the LINK coin price has gone up by 0.71%, according to CoinMarketCap.
Source: CoinMarketCap
CryptoPulse, an analyst, highlighted that LINK is currently testing support of the channel. If this level holds, it may attempt a move towards $9.50. If it breaks the pattern, it could weaken the trend.
Source: X
Moreover, another analyst, CryptoWZRD, mentioned that the LINK price has closed without any directional bias. The price is trading in a tight range.
The overall picture showed that a retest of the $8.20 level has bullish implications. A rise in the price towards the $9.20 level is expected if the level holds as support.
Source: X
Also Read: SEI Tests Key Channel Support With $0.157 Target in Focus
Capital inflows also provided support to LINK’s outlook. SoSoValue data shows a capital inflow of $935,000 on March 6. The day before, there was an inflow of $1.93 million. The total capital inflow is $90.66 million. The figures show that there is continued interest in the cryptocurrency.
Source: SoSoValue
These inflows were recorded at a time when many altcoins were experiencing lower activity. This shows that investors are still investing in Chainlink-related assets.
The Relative Strength Index (RSI) is at 45.39, whereas the RSI-based signal line stands at 45.55. The figures show that the token is in a neutral position. The readings do not show strong selling or buying pressures. The current values indicate balanced activity and a stable short-term trend.
Source: TradingView
The Moving Average Convergence Divergence (MACD) line reads at -0.198, and the signal line is at -0.256. The histogram recorded at 0.058. This indicates a slight positive move and a decline in bearish pressures.
Also Read: CRV Holds $0.20 Support as Momentum Signals Possible Rebound to $0.50

