
Chainlink (LINK) price remained under pressure while trading within a narrow range. The market showed limited direction, with price action reflecting consolidation. Traders continued to watch key levels for confirmation of the next move.
As of writing, LINK’s price is trading at $8.61, showing a 4.94% decline in the past day. The trading volume is up by 5.45% and is currently standing at $582.82 million. Over the last week, the token price has decreased slightly by 0.34%, according to CoinMarketCap.

Also Read: Chainlink Surges 3.8% as Bullish Momentum Targets $18–$20 Range
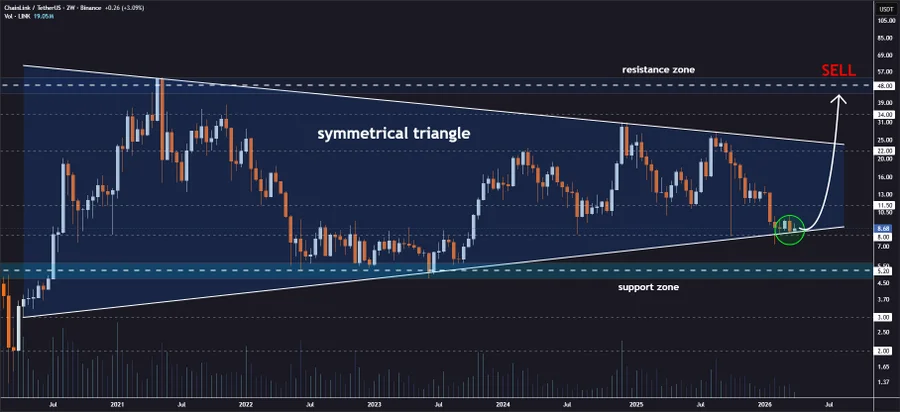
Crypto analyst Jonathan Carter highlighted that Chainlink price is testing support within a symmetrical triangle. The price is holding above the lower boundary on the higher timeframe. This level remains critical for maintaining structure. A bounce from this zone may confirm strength.
If support holds, Carter highlighted potential upside targets, which are $11.50, $22.00, $34.00, and $48.00. Each target is dependent upon momentum. No breakout is confirmed at this point. The pattern stays active until a clear move occurs.
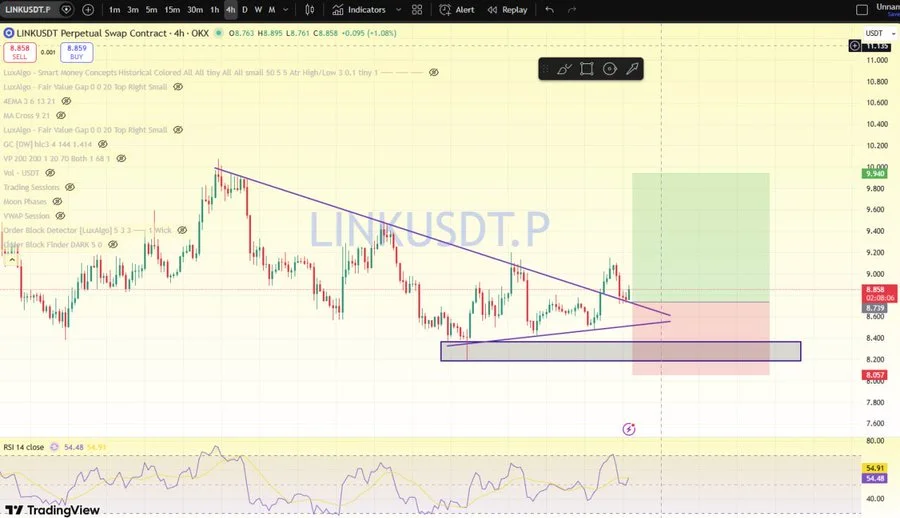
Moreover, another analyst, Bit Bull, provided a short-term outlook. He mentioned that Chainlink price made a breakout on the 4-hour timeframe. The price also performed a retest. Such a scenario could create a long position opportunity. His ideal entry price is in the range of $8.186 and $8.365.
Furthermore, he said that the market is ranging. At present, there is no visible direction. In addition, he warned about the possibility of rejection from order block zones. Traders must be careful if the price fails to sustain its support.
According to CoinGlass data, the activity has slowed down. The futures volume decreased by 8.91% to $472.54 million. In addition, open interest fell by 6.67% to $362.85 million. The OI-weighted funding rate is at 0.0045%, indicating a slight bullish bias.

Liquidation data shows pressure on long positions. The total liquidations amounted to $224.79K in the last 24 hours. Longs were at $221.16K, and short liquidations were relatively lower at $3.64K.

The Relative Strength Index (RSI) indicates weak momentum. The RSI stands at 44.54, whereas its signal line stands at 45.82. Both indicators are below the neutral zone of 50. This clearly highlights a lack of buying pressure and momentum.
The Moving Average Convergence Divergence (MACD) shows minimal activity. The current reading for the MACD is -0.104, while its signal line is at -0.103. Moreover, the histogram reading shows a value close to -0.001. These values indicate low volatility and no clear directional signal.

This article contains market analysis and price predictions. These are not guarantees. Crypto markets are volatile. Always DYOR. Not financial advice.
Also Read: SUI Technical Analysis: Ascending Trendline Retest Could Trigger Rally to $1.40

