
Chiliz (CHZ) is currently consolidating near its 50-day moving average (MA 50), forming a falling wedge pattern on the weekly chart on Sunday, March 8.
According to the crypto analyst Jonathan Cartet, this structure often signals a potential bullish reversal, suggesting that CHZ may be preparing for an upward breakout. Traders are closely monitoring this consolidation, anticipating renewed momentum after recent price fluctuations.
The price has shown strong resilience at current levels, refusing to dip below key support. Buyers have stepped in steadily, signaling confidence in CHZ’s near-term prospects.
The active participation of traders indicates that the market is recognizing value in the token, while selling pressure appears to be weakening. This creates a favorable environment for a potential bullish trend.
Also Read: CHZ Nears Major Breakout: Analyst Predicts Potential Bull Run Ahead
Technical analysis suggests the falling wedge to be a bullish pattern that often culminates in an upward breakout after a consolidation period. The pattern indicates a narrowing swing with reduced downward pressure, a quiet period that often heralds a rally.
Market viewers see CHZ as a well-positioned token, with buyers injecting stability into the market while momentum indicators suggest that the token is poised to move into a stronger uptrend.

Source: Jonathan Carter’s X Post
If the bullish momentum continues to persist in the market for CHZ, the token could potentially target a series of significant price points such as $0.050, $0.085, $0.160, $0.300, $0.530, and $0.850.
Each of these price points can be defined as a resistance point. However, as the current trend indicates that the asset is consolidating with a definite bullish bias, CHZ is a cryptocurrency that investors need to pay attention to.
According to TradingView, as of Sunday, March 8, the relative strength index is at 46.92, indicating a move from a bearish and oversold position to a more balanced position.
While it is not yet in the 50s area, its rise indicates a pickup in buying activity. Essentially, this means that the bearish trend is dying off, although a clear bull trend is not yet established.
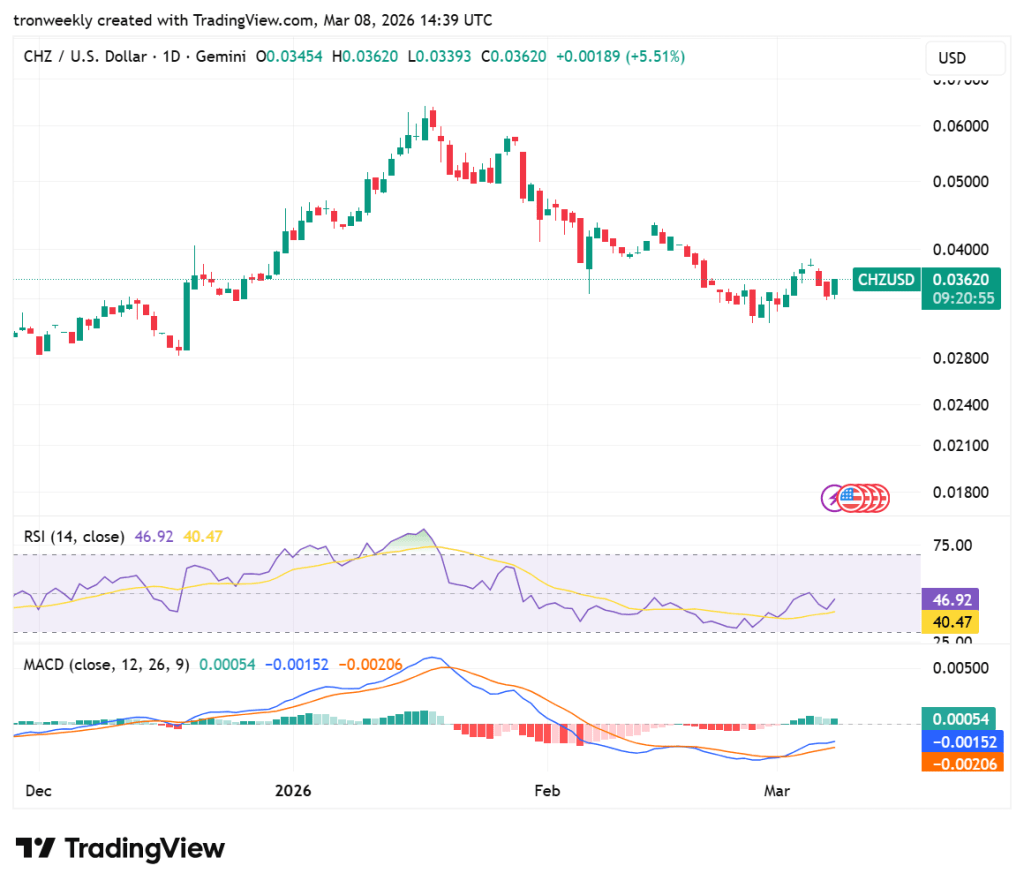
Source: TradingView
The MACD is indicating a change with a new bullish crossover just below the zero line; the blue line moving up through the orange signal line and the green line following suit seems to indicate a short-term reversal.
However, with the lines still stuck in the red, the token seems to indicate a correction rather than a true change in the long-term trend.
Also Read: CHZ Market Structure Flip Signals Upside Continuation Toward $0.066

