Crypto doesn’t crash because traders panic. It crashes because the system itself is designed to liquidate in cascades.
You’ve seen the chart. A market that drifted sideways for days collapses thirty percent in under an hour. The candles are red. The volume bar is the tallest on the screen. And the explanation everyone reaches for is the same: panic, fear, capitulation.
That explanation is comfortable because it’s human. It puts a face on the move. But it doesn’t describe what actually happened.
When price drops sharply in crypto, what you’re watching is rarely a coordinated decision by thousands of traders to sell at the same moment. What you’re watching is a chain of forced events triggering each other.
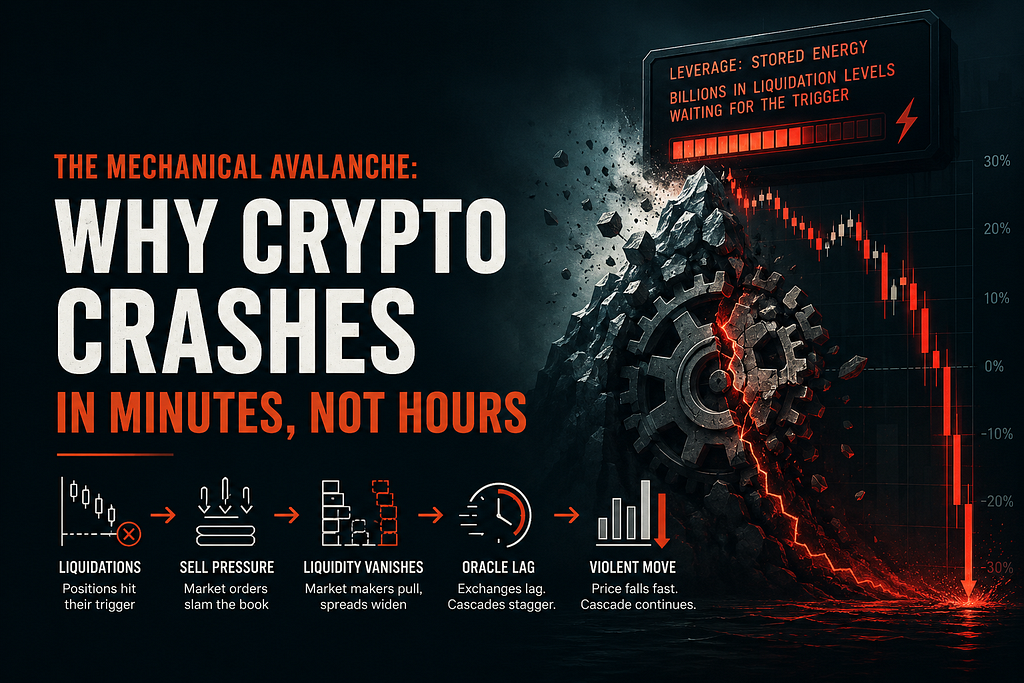
A leveraged long position hits its liquidation price. The exchange engine takes over. The position is closed at market — meaning it sells aggressively into whatever liquidity exists at that level.
That sell pressure pushes price lower. The next leveraged long position, sitting just below, hits its liquidation price. The engine takes over again. The position is closed at market. The price drops further.
This is not panic. This is software executing pre-defined risk rules at the speed the exchange can match orders. The trader doesn’t decide to sell. The trader has already lost the position by the time the order hits the book.
The faster the cascade runs, the less human input matters.
Every leveraged position in the market is a stop order waiting to fire. Not a stop the trader placed — a stop the exchange will place automatically when margin requirements fail.
Aggregate this across an entire exchange and you have something resembling a charged capacitor. Billions of dollars of forced-sell orders sit at known price levels, waiting for the trigger.
In quiet markets, this stored energy is invisible. Funding rates drift. Open interest climbs. Volatility compresses. Everything looks calm.
The calm is misleading. It’s actually the silence that precedes structural breaks — the period when leverage accumulates faster than the market can absorb it. The longer the quiet lasts, the more energy is stored, and the more violent the eventual release.
This is why the deepest crashes often follow the calmest weeks. The volatility hasn’t disappeared. It’s been deferred. And deferred volatility, in a leveraged system, doesn’t dissipate. It compounds until something releases it.
In normal conditions, market makers provide bids and offers across the order book. Their job is to capture the spread between them. They want price to move, but slowly — not violently.
When volatility spikes, market makers face an asymmetric risk. If they keep quoting tight bids during a crash, they end up holding inventory that’s dropping faster than they can hedge it. Their models tell them to widen spreads or pull quotes entirely.
So they do.
The bid side of the order book thins out. The supportive structure that absorbed normal selling pressure disappears in seconds. The same volume of forced selling that would have moved price half a percent in calm conditions now moves it five percent in fast conditions.
This is the second mechanical layer. The cascade isn’t just the liquidations. It’s the disappearance of the counterparties who would normally slow the fall.
Crypto markets aren’t one market. They’re a network of exchanges, each running its own matching engine, each pricing assets slightly differently, each updating its index price at slightly different intervals.
When price moves fast, these differences become exploitable. An exchange that updates its oracle price every few seconds will lag the spot move. Liquidation thresholds calculated against a delayed price will trigger at different moments than thresholds calculated against the live tape.
Some positions get liquidated based on price that’s already wrong. Others survive moves that should have closed them, only to be closed seconds later when the lagging oracle catches up.
The effect is staggered cascades across venues. Exchange A liquidates first, pushing price down. Exchange B liquidates a moment later as its index catches up. Arbitrage bots move the price further as they balance the spread between venues.
Each step looks small in isolation. Stacked together, they produce the vertical candles you see on the chart.
If you’ve traded equities, the speed of crypto crashes can feel pathological. Stocks don’t collapse this way. Even during severe selloffs, the move tends to unfold across hours or days, not minutes.
The reason is structural, not psychological. Equity markets have circuit breakers, designated market makers with obligations, settlement timelines that slow position changes, and limited retail access to high leverage. The system is designed to introduce friction during stress.
Crypto has none of that. The exchanges run 24/7 with no halts. Leverage is available to anyone with a few hundred dollars. Settlement is instant. Liquidation engines are automated and uncoordinated across venues.
For a deeper view of how this architecture shapes price behavior, the complete breakdown of crypto market structure covers the design choices that make these cascades possible — and why they’re not bugs, but consequences of the system as built.
The result is a market where the mechanical path of least resistance during stress is straight down, fast. Not because crypto traders are uniquely fearful, but because nothing in the architecture is designed to slow the fall.
When a crash happens, the temptation is to look for the news. What triggered it? What changed? Which narrative shifted?
Sometimes there is news. Often there isn’t. The cascade can ignite from a relatively small move that happens to push price into a cluster of liquidation levels. Once the chain starts, it runs on its own logic until enough leverage has been cleared from the system.
Reading the crash as a behavioral event leads to behavioral predictions. The market will bounce when fear subsides. Traders will buy the dip. Sentiment will reverse.
Reading the crash as a mechanical event leads to different observations. The bounce, when it comes, happens when forced selling exhausts itself — not when sentiment shifts. The recovery is initially structural: market makers return, spreads tighten, the liquidation queue clears. The traders who buy the bottom aren’t braver than the traders who sold it. They’re just operating after the mechanical pressure has finished.
This distinction matters because it changes what you watch. Sentiment indicators don’t help you time a cascade. Open interest, funding rates, and the distribution of leverage do.
After a major liquidation event, the market often goes quiet. Funding resets. Open interest collapses. Volatility drops. The chart looks calm again.
This calm is real, not deceptive. The stored energy has been discharged. The leverage that fueled the cascade has been cleared. The system is, briefly, in a low-tension state.
Then it begins to rebuild. New positions get opened. Funding starts to drift again. Open interest climbs. The capacitor recharges.
This cycle is the actual rhythm of crypto markets — not the bull and bear narratives layered on top, but the slower oscillation of leverage accumulating and discharging. Most traders never see this rhythm because they’re watching price candles, which only show the discharge events.
The accumulation phase is invisible on a chart. It’s only legible in the derivative metrics: funding history, OI growth, liquidation maps. These show the energy building before the cascade arrives.
If the crash is mechanical, the trader’s role during it is limited. Stops get filled at prices that don’t match where they were placed. Limit orders sitting below the market get filled instantly as the cascade sweeps through them. Positions that looked safe at one volatility regime become unsafe in the next.
The actions that matter happen before the cascade, not during it. Position sizing relative to expected volatility. Leverage chosen with the worst case in mind rather than the average case. Recognition that calm markets are not safe markets — they’re loaded markets.
During the cascade itself, the trader who survives is usually the one who already prepared for the possibility. Not because they predicted the trigger, but because they understood the system was always one trigger away.
The crash isn’t an event. It’s a release. The question isn’t whether it will happen, but how much energy is stored when it does.
More from SwapHunt:
Free download: The Cost of Being Early — On positioning before the market moves.
Follow @SwapHunt for daily observations.
This content is for educational purposes only. Not financial advice.
The Mechanical Avalanche: Why Crypto Crashes in Minutes, Not Hours was originally published in Coinmonks on Medium, where people are continuing the conversation by highlighting and responding to this story.

