
Current positioning reflects caution rather than panic, with price sustainability near historical support still under observation.
In a recent post, analyst Ali identified LINK retesting an ascending support line that has remained valid since mid-2023. Multiple recorded reactions along this trendline reinforce its historical relevance, though the present position shows the coin hovering close to the lower boundary, increasing breakdown sensitivity compared to prior cycles. Ali highlights $12 and $11 as the nearest horizontal support layers if a structural violation occurs.
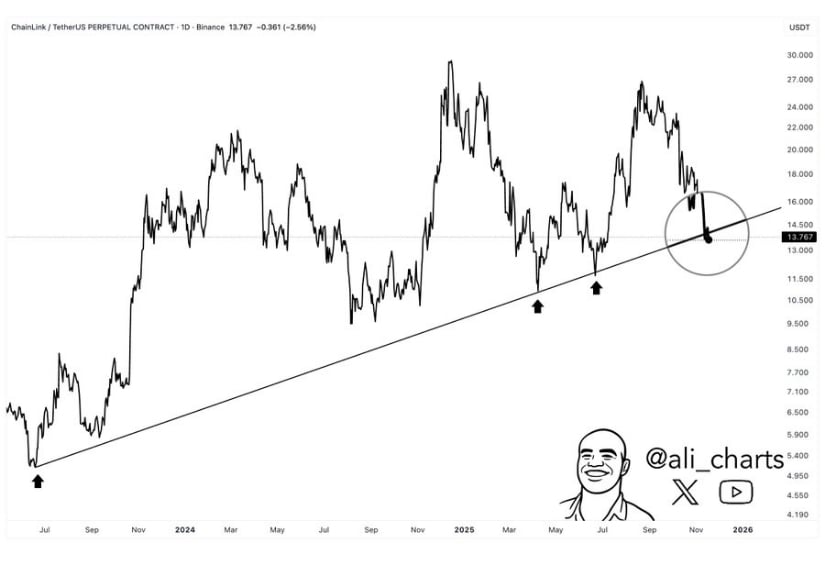
Source: X
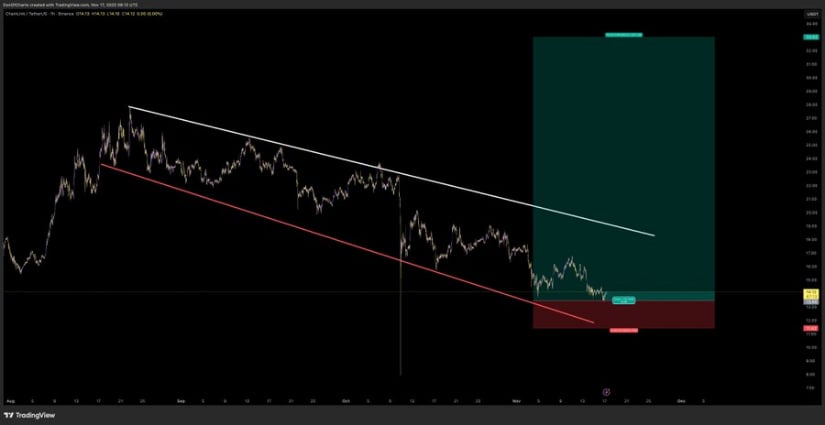
An additional long-range interpretation from @DonaldsTrades frames the coin inside a broader descending channel, with $11-12 functioning as an accumulation reference rather than panic territory. His outlook suggests channel preservation could facilitate a long-cycle recovery path, although any upside projection remains conditional and unconfirmed within the current price structure.
Over the past 24 hours, the token recorded a -2.70% decline, trading near $13.65 after failing to hold above the $14.03 resistance zone. The price action shows a steady intraday downward movement, with selling pressure increasing as traders secured profits following a short-term rally.
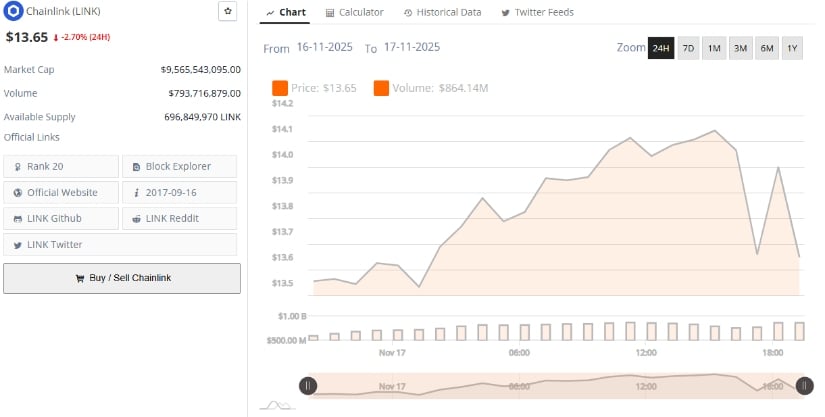
LINKUSD 24-Hr Chart | Source: BraveNewCoin
Despite the pullback, the market capitalization stands at approximately $9.5 billion, keeping it among the top twenty cryptocurrencies by valuation. The price is currently consolidating near the $14.03 range, a level that could serve as a short-term accumulation base.
Recent market reporting places LINK trading near $14.13 with volume and market participation reflecting stable but non-expansive engagement. Trading within an observed $3.70–$15.00 intraday bandwidth indicates range-bound activity rather than volatility-driven displacement. The structure aligns with a neutral market phase rather than accumulation expansion or widespread liquidation.
Source: X
No abnormal supply-driven pressure has been recorded within recent sessions, and volume tapering suggests temporary positioning restraint as market participants monitor confirmation signals at macro support levels instead of initiating high-risk exposure.
LINK trades slightly above the lower Bollinger Band near $13.03, indicating price proximity to potential oversold territory, while the mid-band at $15.55 forms the preliminary reference for bullish reclaim. Bollinger compression continues to narrow, signaling contracting volatility and an upcoming expansion phase dependent on breakout direction rather than pattern bias.
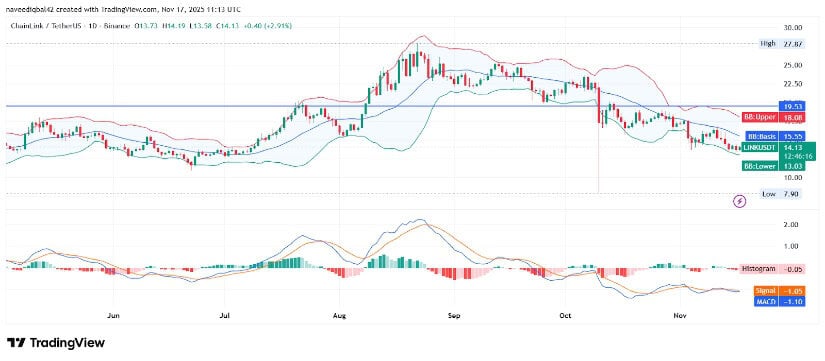
Source: TradingView
MACD readings remain below zero, maintaining a technical bearish stance, though histogram flattening suggests reduced bearish momentum intensity. A confirmed daily close above $15.55, combined with sustained volume expansion, would form the earliest valid technical recovery signal, whereas failure to maintain current positioning may re-expose the $12–$11 support sequence for further observation.


