
Curve DAO Token (CRV) declined 2.93% in the past 24 hours on April 20, 2026, as traders locked in profits following recent upward momentum.
The pullback comes after a strong weekly performance, where CRV still maintains an 8.88% gain despite short-term volatility.
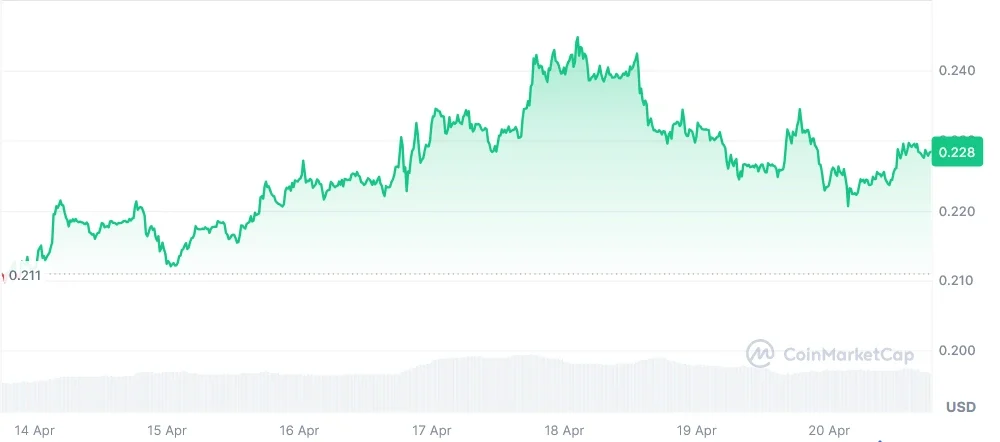
Despite an intraday pullback, CRV remains positive, posting an 8.88% weekly gain with sustained bullish momentum and rising trader activity.
According to CoinMarketCap data, the token is trading at $0.2281. The 24-hour trading volume is $61.64 million, up 2.97%, while market capitalization stands at $340.66 million, down 2.94%.
Also Read: Curve DAO (CRV) Holds Descending Channel Support, Eyes $0.34 Target
CRV is trading inside a well-defined descending channel, with price currently reacting at a key support zone around $0.20–$0.23.
This area aligns with channel support, where traders are watching for a bounce toward $0.30–$0.35 as short-term resistance levels come into play.
From a trading perspective, structure remains bearish until price breaks above mid-channel resistance and reclaims $0.45–$0.55, according to the crypto analyst Butterfly.

A rejection here could offer short opportunities, while a confirmed breakout may trigger long setups targeting higher levels within or beyond the channel.
If this level of $0.20 fails, the demand from traders would be to continue with shorts targeting $0.16 and $0.12, respectively.
The volume and higher low pattern would be the key factors to watch out for. Unless there is a breakout, this would be a range trade play on the downside trend.
Technical indicators suggest that bearish pressure is beginning to weaken. The Relative Strength Index (14) stands at 34.29, although its moving average is at 32.25, placing it in the lower range without being considered oversold.
There has been a slow reduction in momentum, characterized by lower highs from 2025. The momentum is mildly bearish, although a flattening is suggestive of stability or potential reversal.
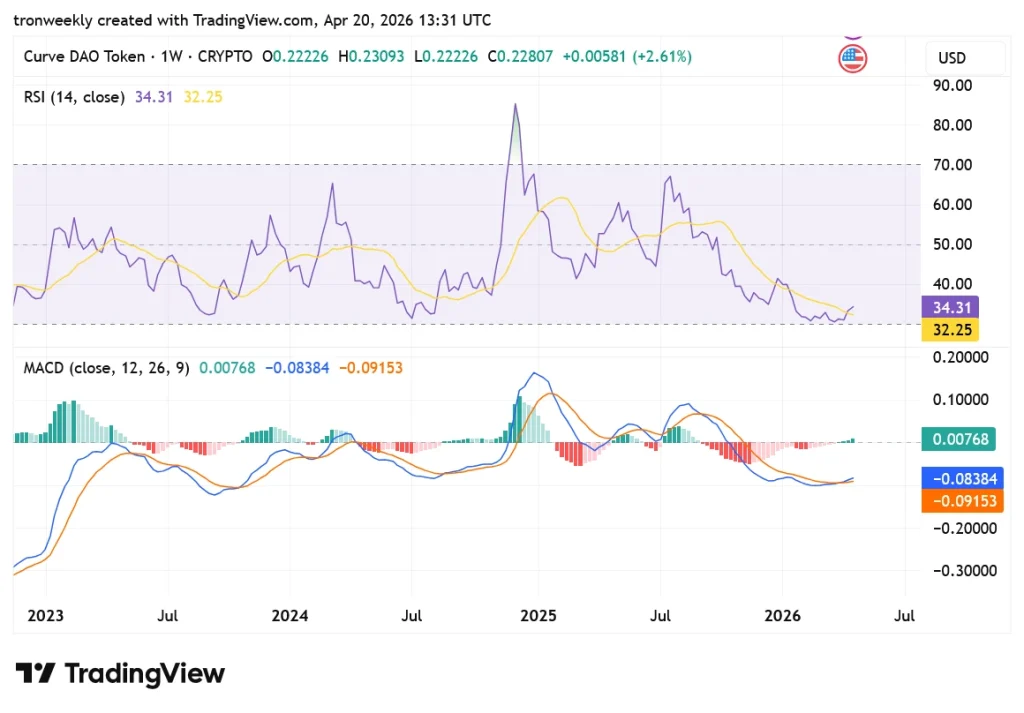
The MACD is at 0.00768, with the signal line at -0.09153 and the MACD line at -0.08385. Although it still holds a negative figure in total, there seems to be a gradual shift towards the positives for the bars of the histogram.
This article contains market analysis and price predictions. These are not guarantees. Crypto markets are volatile. Always DYOR. Not financial advice.
Also Read: Curve DAO Token Analysis: Can CRV Reach $0.55 Amid Market Consolidation?

