
DASH continues its volatile run, slipping sharply after a week of impressive growth. Over the last 24 hours, the token has fallen by nearly 10.7%, reflecting short-term selling pressure after strong profit-taking. Despite this drop, DASH still maintains a solid 33.98% gain over the past week.
At the time of writing, DASH is trading at $41.06, with its 24-hour trading volume at $380.6 million, down by 17.58%. Its market capitalization has also declined by 10.11%, now standing at $512.04 million.
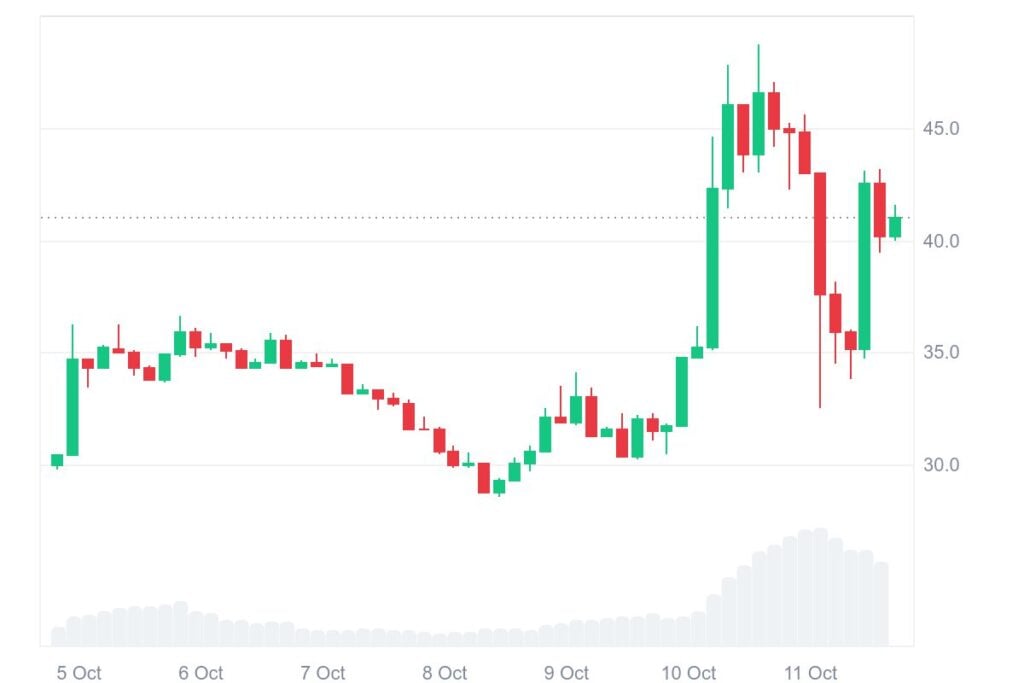
The recent price drop suggests that bulls are taking a short breather after an aggressive run-up. However, the token’s overall market structure still indicates underlying resilience, as it remains well above recent support levels.
Also Read: The SEC Classifies DASH As a Security, XRP and SPCT Primed for Massive Price Surges
Despite the recent price dip, DASH’s community sentiment remains overwhelmingly positive. Data shows that 84% of the 41.4K participants are optimistic about the asset’s future direction. This high confidence level indicates a collective belief that the current weakness could be temporary, with many anticipating another upward move.
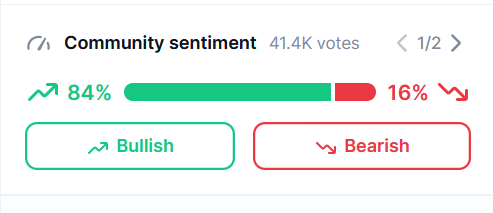
Just 16% are bearish, which indicates that fear and doubt are still contained among investors. This differential shows a market greatly skewed towards optimism, which could witness renewed buying demand return soon as volatility seeps out. Such an overwhelmingly bullish sentiment has always driven renewed participation and a potential breakout when momentum and technicals are aligned.
Chart Analysis shows that DASH is building a gigantic falling wedge structure on the two-week chart, a pattern that has been in form since the year 2021. It is a pattern that normally signals long-term reversals. Recently, the price has bounced back very strongly from the support region of $19–$21, signaling some new accumulation and renewed buying interest in lower levels.
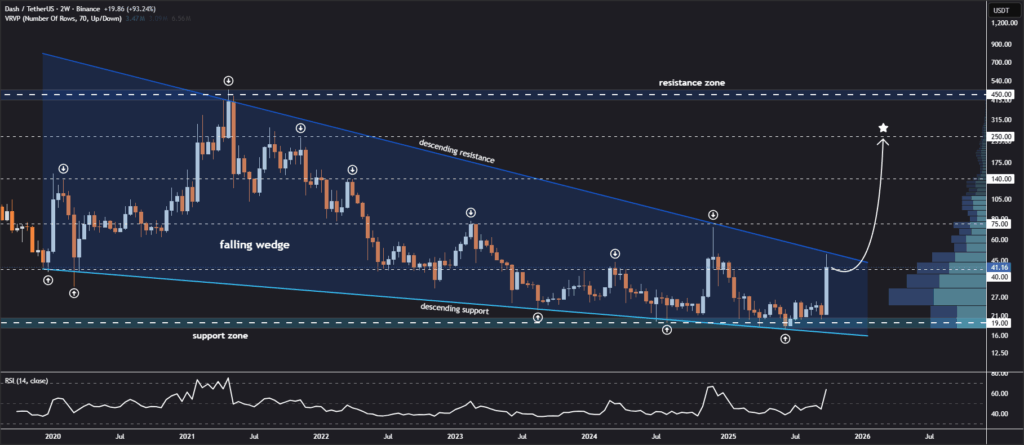
If DASH crosses the lower descending resistance around $45–$50, it may validate the initiation of a large positive phase. Technical analysts estimate a move towards $75, $140, and maybe $250 if momentum gathers pace. RSI has also crossed higher from the oversold levels, supporting the positive mood.
Overall, DASH seems to be heading towards a crucial technical turning point. Realizing support above $19 and crossing higher than $50 may create a stage for a long period recovery, preparing the asset for a protracted positive phase during the upcoming few months.
Also Read: Sui, Dash, Tradecurve Price Forecast for July: Which Crypto Will 10X


