
Despite this price pullback, the asset maintains a market capitalization of $799 million, with a 24-hour trading volume of $312 million.
According to the latest analysis by Ai4Alpha on X, Dogwifhat has broken through the crucial support level at $0.80, a key price point that had previously served as a floor. This breakdown has been accompanied by a sharp decline in price, and the Relative Strength Index (RSI) has dropped to 25.95, indicating that the token is in oversold territory.
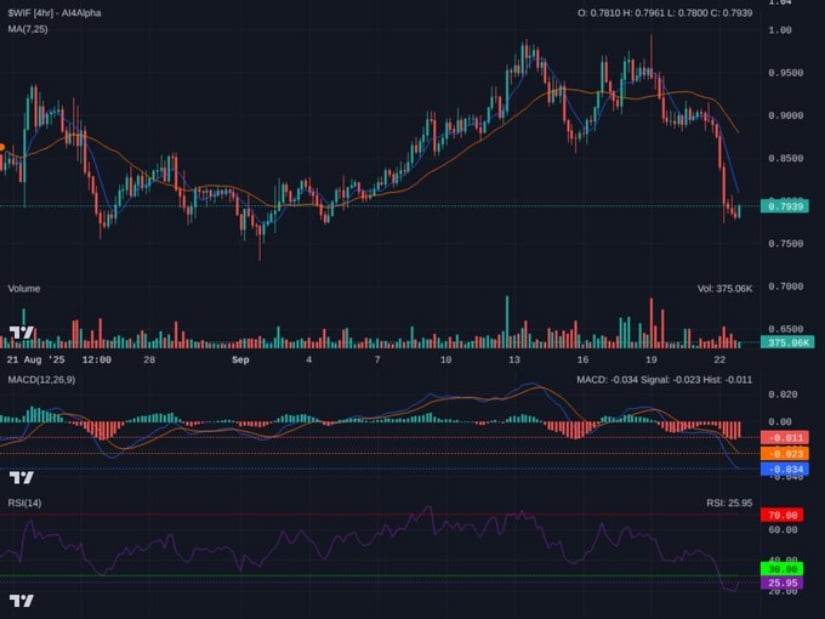
Source: X (@Ai4Alpha)
Typically, an RSI reading below 30 suggests that an asset is oversold and could be due for a short-term bounce. However, other technical indicators, including the MACD and Moving Averages (MAs), continue to confirm a strong downtrend. This combination of signals creates a conflicting outlook for traders, as while there may be a short-term recovery, the overall trend remains bearish.
On one hand, in terms of market fundamentals, BraveNewCoin data shows that the token is trading at $0.80, maintaining a market cap of $799 million and a circulating supply of approximately 998 million tokens.
Despite the recent drop, the project continues to see active trading, with the token’s daily trading volume standing at $312 million. This suggests that while the price has been under pressure, Dogwifhat still maintains liquidity and market interest.
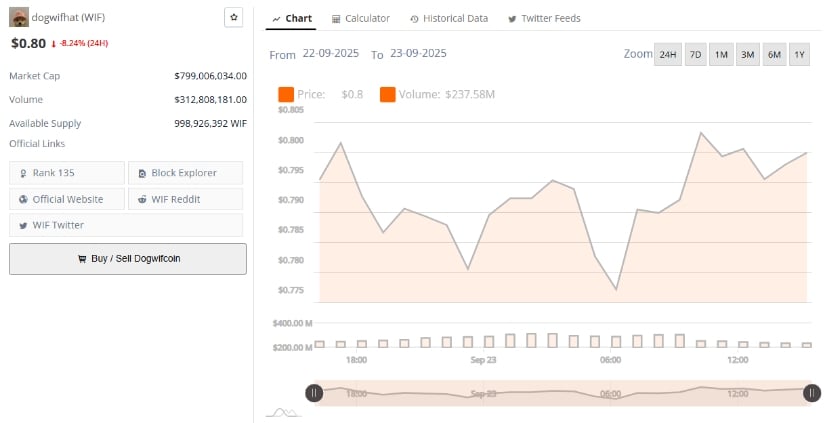
Source: BraveNewCoin
The broader cryptocurrency market has also shown some weakness recently, which could be contributing to the coin’s struggles. The Solana blockchain, on which the crypto operates, has seen fluctuations in token prices across the ecosystem, and this volatility may be impacting the price of the asset.
However, despite these challenges, the active trading volume signals that investors and traders are still monitoring the token closely, and further price action could offer new opportunities depending on how key levels hold.
On the other hand, looking at the 1-day chart provided by TradingView, the technical indicators suggest that Dogwifhat is still in a bearish phase. The MACD continues to print negative histogram bars, confirming weak momentum.
The Relative Vigor Index (RVI) stands at 47.59, below its moving average of 57.38, further indicating a lack of bullish conviction. The RVI is a tool used to gauge the strength of a trend, and the current low readings signal that buyers have yet to take control.
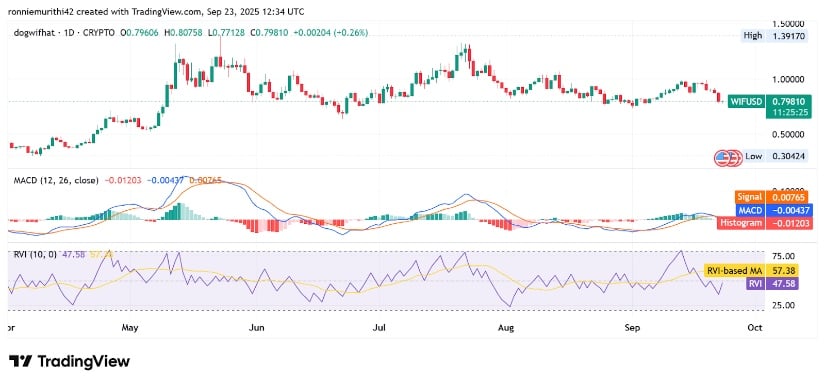
Source: TradingView
With the price now facing resistance at the $0.80 level, traders should remain cautious. The potential for a short-term bounce exists, particularly given the oversold RSI and the market’s general volatility.
However, unless the cryptocurrency can reclaim the $0.80 level and show clear signs of sustained upward momentum, the risk remains tilted toward further downside, with potential targets near $0.75 or even lower.


