
Dogecoin (DOGE) has a history of explosive market cycles that continue to capture investor attention. According to the crypto analyst Hailey LUNC, as of Friday, March 6, in its first major run, the meme-inspired cryptocurrency surged roughly 95x from its lows.
The second cycle proved even stronger, delivering around a 310x rally during the 2020–2021 crypto boom, fueled by retail hype, social media momentum, and support from Elon Musk.
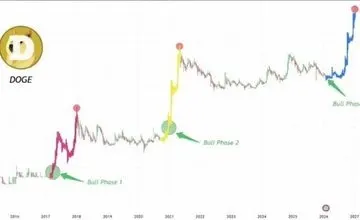
Source: Hailey LUNC’s X Post
With speculation building around a potential third cycle, some analysts believe Dogecoin could see another powerful rally if the broader crypto market enters a new bull phase.
Optimistic projections circulating in the community suggest the token could climb toward $5 if adoption, investor sentiment, and market liquidity align during the next wave.
Also Read: Dogecoin (DOGE) Slumps to $0.089 as Bears Dominate with $0.13–$0.15 Target
According to TradingView, as of Friday, March 6, the DOGE price shows a strong bearish trend from the latter half of 2025 to the early months of March 2026.
The price movement is constantly below the 200-day EMA at $0.149 and the 100-day EMA at $0.123. This shows strong overhead resistance, and the gap between the price and the averages shows a lack of momentum in the cryptocurrency.
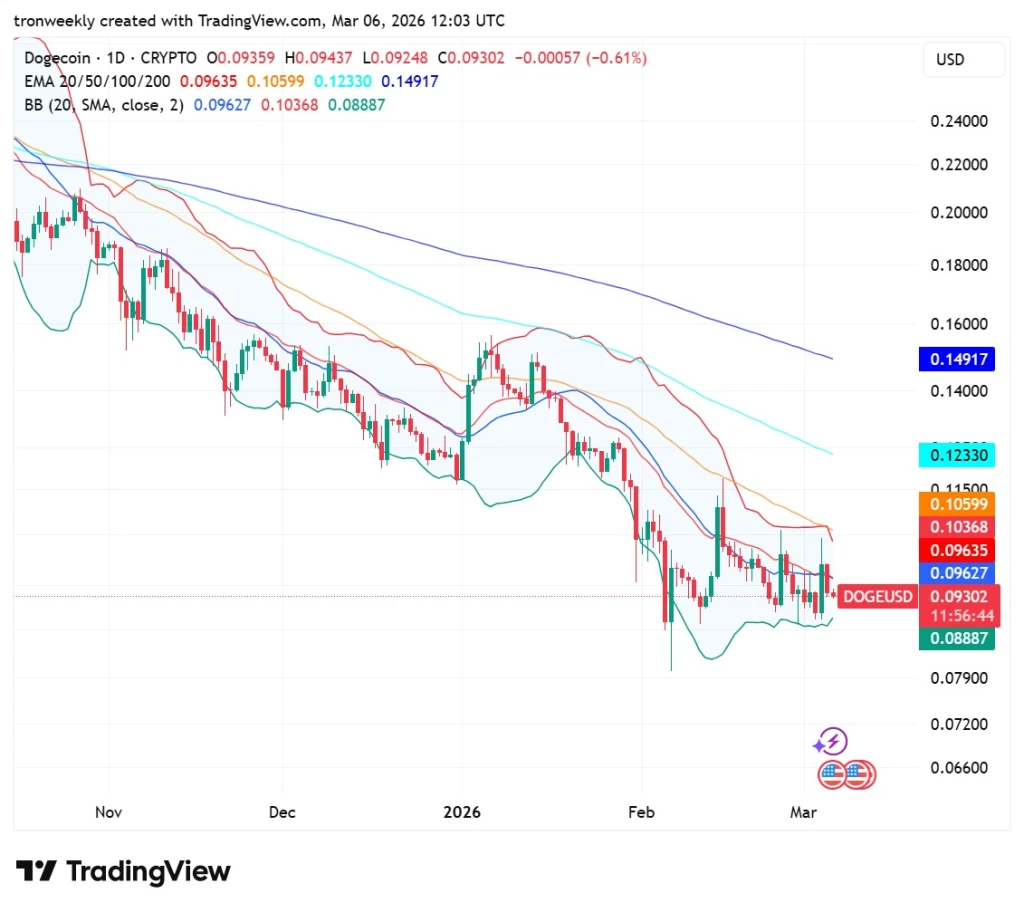
Source: TradingView
Currently, the token is consolidating around the $0.093 mark, which is between the bands. The immediate resistances to the rise in the price are the 20-day EMA at $0.096 and the 50-day EMA at $0.105.
Until the price manages to rise and close above these resistances, the trend is likely to remain sideways or test the support floor at $0.088.
The relative strength index, which is currently at 44.36, is at a neutral momentum, slightly leaning towards bearish.
The line is still below the 50 midline but remains above the 30 oversold level, which means there is no sign of exhaustion. The purple RSI line is closely trailing its yellow counterpart, which is an indication of indecision.
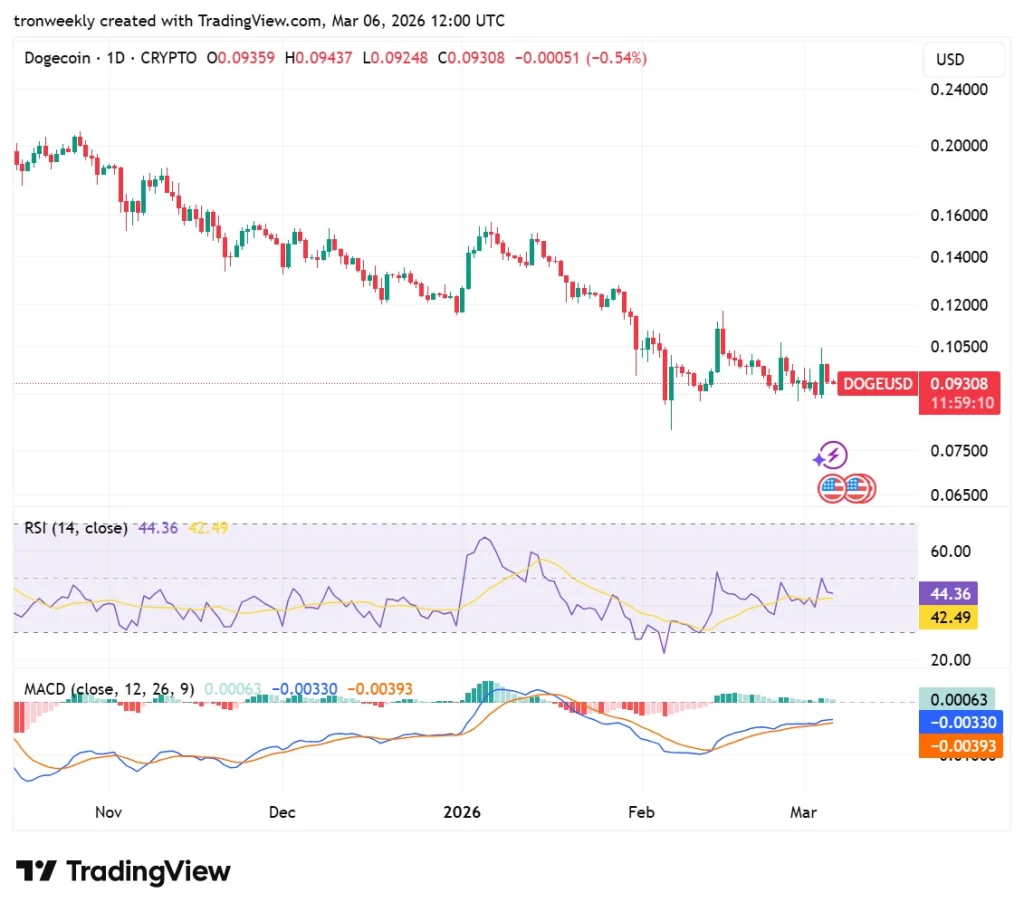
Source: TradingView
The MACD indicator is also indicating the possibility of a bullish crossover, as the blue line is moving towards the orange signal line.
Although both lines are currently below the zero level, this is an indication of the primary trend being a downtrend. The histogram is now in light teal, indicating that the selling pressure is easing for the asset.
Also Read: Dogecoin Plummets to $0.094: Could DOGE Surge to $3 Next?

