
Dogecoin (DOGE) is currently trading within a descending channel pattern on the daily chart on Monday, March 9, a structure often linked with corrective market phases.
According to the crypto analyst Jonathan Carter, the token is hovering near the midline of the formation, a level analysts consider an important pivot zone. Holding this area could indicate growing accumulation as traders anticipate a potential shift in momentum.
Jonathan Carter notes that descending channels typically reflect controlled downward trends where prices move between parallel falling trendlines.
However, stabilization around the middle or lower region of the channel can sometimes suggest weakening selling pressure. If buyers step in at this stage, the pattern may transition from a correction phase into the early stages of recovery.
Also Read: Dogecoin Price Analysis: DOGE Holds $0.095 Support, Eyes $0.114 Breakout
If the price bounces from the current zone, there are various resistance levels that could serve as the price targets for the cryptocurrency.
Jonathan Carter is closely observing the potential price movement that could reach the $0.100 and $0.116 price levels first. Further bullish price movement could allow the price to reach the $0.135 and $0.153 price levels.

Source: Jonathan Carter’s X Post
A stronger rally could propel DOGE into higher resistance zones such as $0.182 and perhaps $0.206 if market sentiment improves considerably.
For now, however, market participants are focused on whether the meme coin can hold its support within the range. If so, it could mean that the market is quietly positioning itself for the next move for Dogecoin.
According to TradingView, as of Monday, March 9, the Relative Strength Index is currently at 49.89, which indicates a neutral market condition where the bulls and bears are not dominant.
The RSI has moved from the lower oversold area and has crossed the signal average of 41.43. However, the fact that the RSI is still below the 60.00 level indicates that the momentum is being held back in the Dogecoin market.
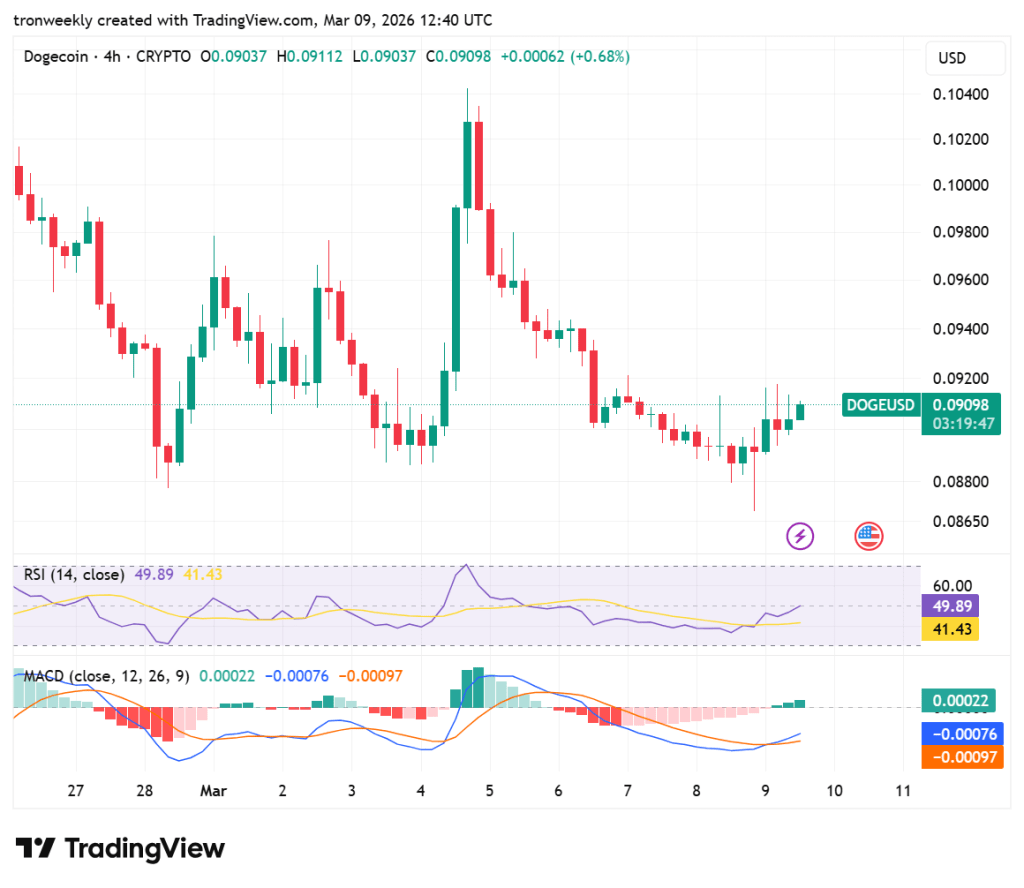
Source: TradingView
The MACD indicator is showing an opportunity for a trend shift as the blue line is trying to make a bullish crossover above the orange line.
Although both lines are still in negative territory at -0.00076 and -0.00097, respectively, the histogram is now in green. This is showing that selling pressure is running out at last.
Also Read: Dogecoin Signals Trend Reversal, Eyes $0.16 Breakout

