
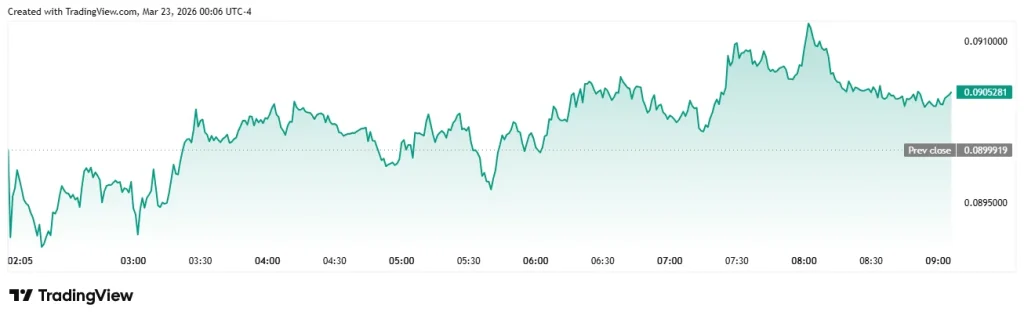
Dogecoin (DOGE) is showing signs of pressure, with the popular cryptocurrency trading at $0.09052, having declined by 1.17% in the last 24 hours. The token is showing strong trading volumes, with $1.28 billion in trade in the last day, while the current market capitalization stands at $13.96 billion, accounting for 0.60% of the total cryptocurrency market.
Recent market observations suggest that Dogecoin is approaching a critical phase after spending years moving within a broad price channel. According to a recent post by analyst Ali Charts, DOGE has historically traded between $0.0537 and $0.4595. After previously testing the upper boundary of this range, the price is now gradually moving back toward the lower support zone.
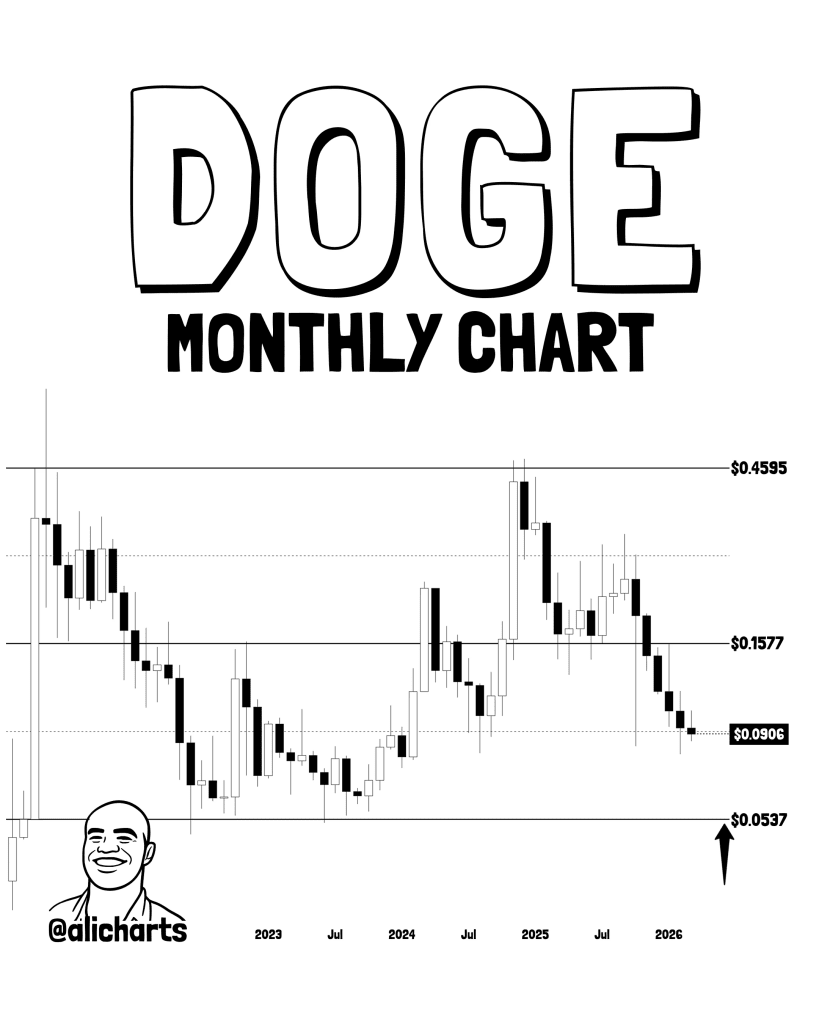
DOGE has already tested the higher end of the range, and now it is gradually moving towards the lower end. The token is showing signs of pressure, and a major move may occur when it reaches the $0.0537 support level, a strong support point. The move is expected to result in a 200% move to $0.16, which is the mid-range point.
Also Read | Polkadot Holds Steady at $1.41 as Breakout Target Nears $4.50 Amid ETF Boost
From a technical perspective, Dogecoin is continuing to trade in a descending triangle formation on its weekly chart. The descending triangle is identified by a series of lower highs in its chart pattern. This means that while Dogecoin is attempting to trade higher, it is being forced to return to its lower levels due to increased selling pressure. Dogecoin is getting closer to an important support zone ranging from $0.09 to $0.10.
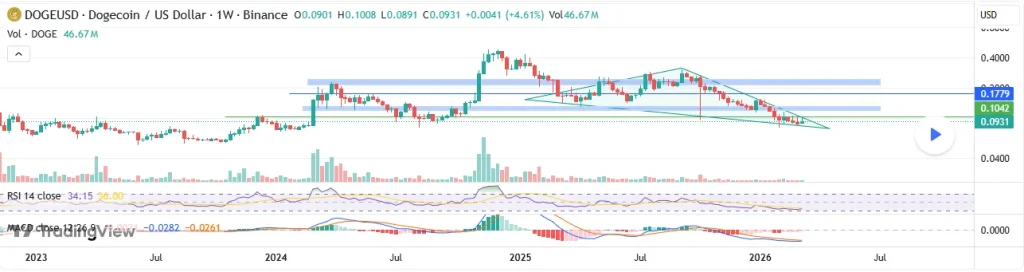
The Relative Strength Index (RSI) is also reflecting an unfavorable period for Dogecoin. The RSI is near oversold levels, which means that its decline in value has been strong in recent times. The MACD indicator is also in a bearish position, which means that its decline in value has not yet slowed down.
Some important levels are in focus in the Dogecoin chart. The immediate support level for Dogecoin is near $0.09, while its resistance levels range from $0.17 to $0.18. If DOGE can trade higher in its next attempt, its next resistance levels are near $0.20 and $0.25.
However, if its support levels are broken, its next levels to trade are near $0.075 and $0.065. Dogecoin is in a tight range at present, which is a common phenomenon before a sharp move in its value. However, its next direction is dependent on its ability to trade out of its current support zone.
Also Read | Zcash Struggles to Hold Support as $300 Reclaim Becomes Critical for Bulls

