Dogecoin (DOGE) price has roared back into the spotlight, surging nearly 70% in just three weeks. But is this rally sustainable—or is it heading for a correction? Let’s dive deep into the Dogecoin price chart and RSI signals to find out. We had already predicted that Dogecoin price could be on the verge of a good rally.
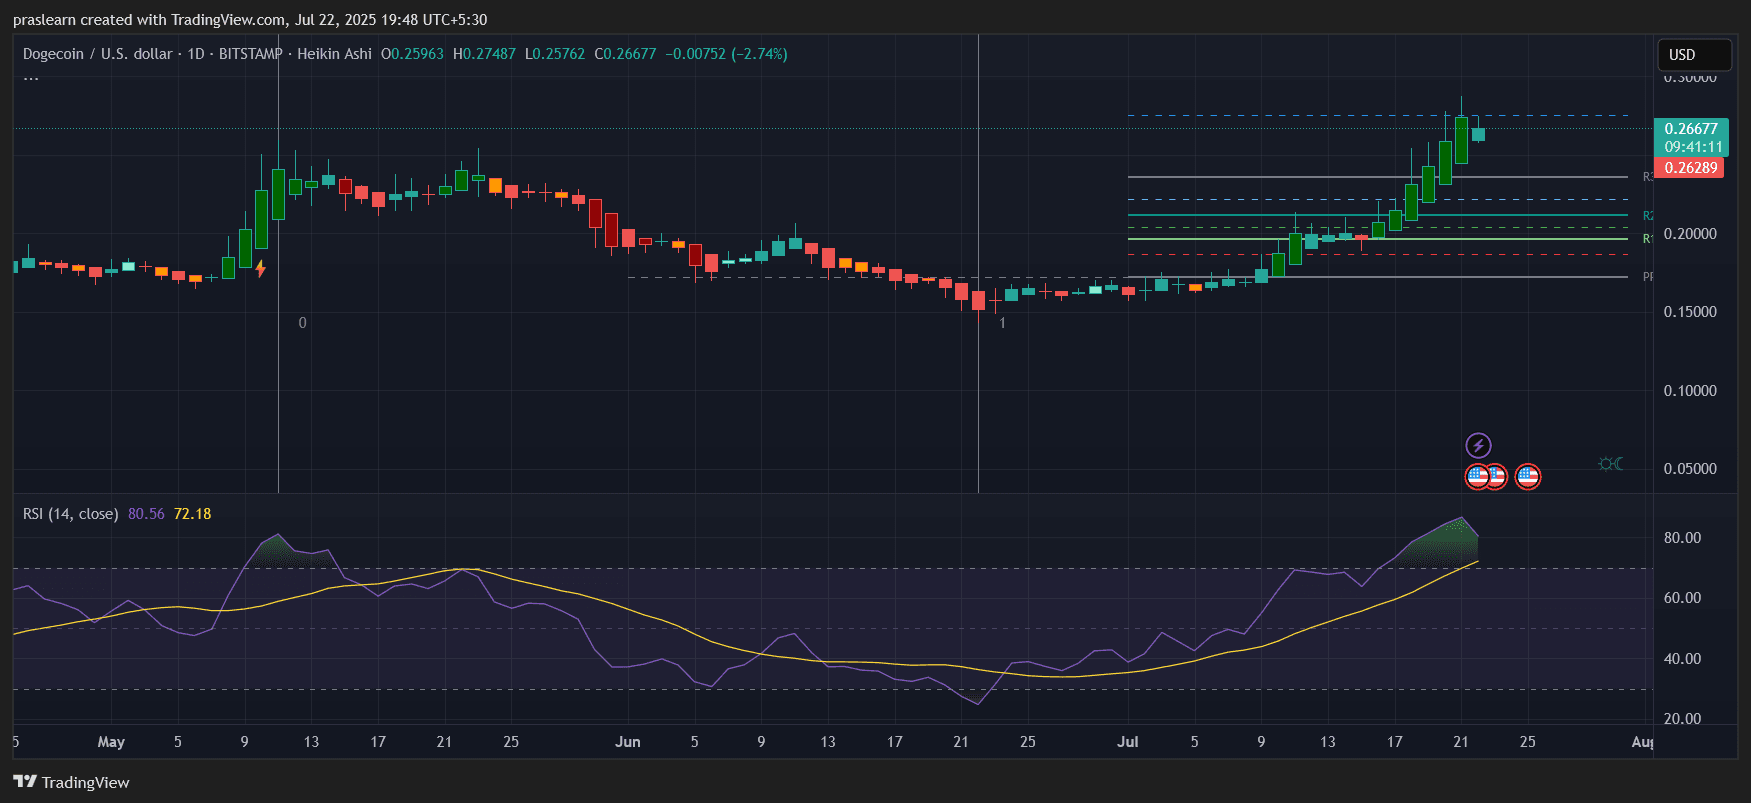
Dogecoin price has climbed from a low near $0.155 in early July to a high of $0.274 in just over 20 days, marking an approximate 76% increase. This explosive move is backed by strong green Heikin Ashi candles, signaling consistent bullish momentum. The recent breakout above the $0.21–$0.23 resistance zone has triggered FOMO among retail investors and possibly some institutional traders looking to ride the momentum.
This move is likely influenced by speculative market enthusiasm, broader altcoin recovery, and growing Dogecoin network activity (as reported by on-chain trackers). But the real story is told by the technicals.
The Heikin Ashi chart shows uninterrupted bullish candles since July 7, indicating a very strong trend. There’s no sign of upper wick exhaustion yet, suggesting the uptrend might not be over.
The DOGE price cleanly broke out of the previous Fibonacci resistance at $0.236 and has now reached just above $0.266. This level corresponds to the 1.618 Fibonacci extension from the $0.15–$0.23 rally base.
Fibonacci Extension Calculations:
This implies $0.36 could be a realistic short-term target if momentum continues.
The RSI (Relative Strength Index) is currently at 80.56, which is well into overbought territory. This typically signals a possible upcoming pullback or consolidation. However, in strong bull runs, RSI can remain overbought for extended periods. A key support to watch is the RSI 72 zone—if DOGE holds above it, it could sustain the rally longer.
The last time RSI was this elevated (mid-May), DOGE experienced a pullback within 3–4 days. If history repeats, we may see a small dip to $0.24–$0.25 before another leg higher.
If DOGE price manages to close a daily candle above $0.275 with high volume, it could trigger another wave of buying and push the price toward $0.30–$0.36 in short order.
Given the parabolic price action, the probability of a short-term pullback is rising. However, unless Dogecoin price breaks below $0.234, the broader bullish structure remains intact. If buyers defend the $0.24–$0.25 zone on any dip, it would validate continuation toward $0.35.
But caution is warranted. Overbought RSI and a 70% rally within 20 days suggest DOGE price could consolidate sideways or retrace slightly before the next leg. A move above $0.275 will be critical for momentum.
Yes—but not without a fight. If momentum holds and $0.275 is broken cleanly, Dogecoin price could test $0.30 quickly and then stretch toward the $0.35–$0.36 zone. However, traders should be prepared for brief dips to the $0.24–$0.25 zone as RSI cools down.
Short-Term Prediction:
OKX is a top choice to buy DOGE. With low trading fees, extensive token listings, and an intuitive interface, it’s a preferred platform for many crypto traders across Europe.
Special Promotion – Limited Time
Until September 14, 2025, OKX is hosting an exclusive McLaren F1 Team giveaway:
--> Receive a complimentary McLaren F1 Team cap <--
Enter to win a VIP trackside experience in Zandvoort (Aug 29–31)
This offer is open to all new European users who haven’t yet traded on OKX. Don’t wait – claim your reward today!
$DOGE, $DogecoinPrice, $Dogecoin

