
Dogecoin (DOGE) rises 2.97% on March 25, 2026, as renewed buying interest pushes the memecoin closer to the critical $0.10 level.
Despite this short-term strength, weekly performance remains weak, showing a 2.11% decline and signaling mixed market sentiment across traders.
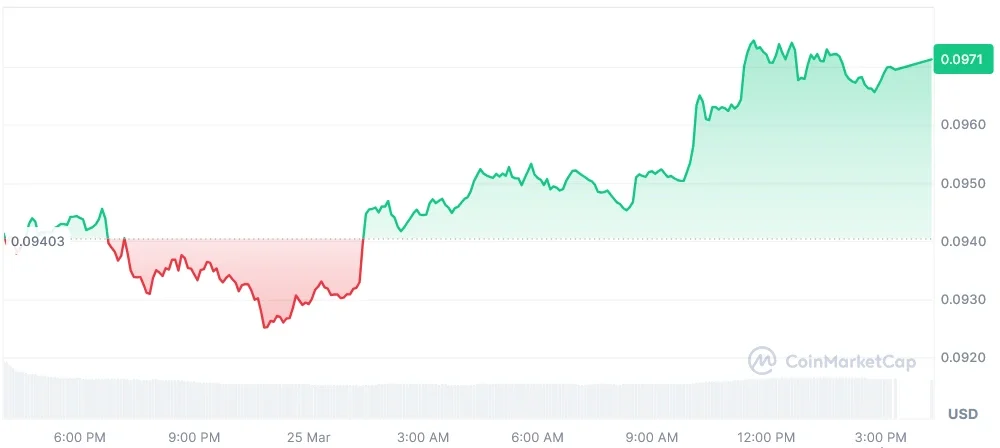
Currently, DOGE is trading at $0.09687, with a 24-hour trading volume of about $1.19 billion, which represents a 25.07% decrease in trading activity.
Despite this, the market capitalization stands at $16.39 billion, which suggests a possible uptrend in the market, according to CoinMarketCap data.
Also Read: Dogecoin Risks Breakdown as $1.79M Liquidations Hit
Dogecoin on the daily timeframe continues to trade under a broader bearish structure despite recent stabilization.
The price action remains locked in tight under the falling moving averages, the 100 SMA, and the 200 SMA, rolling over and looking like moving barriers, preventing any real upward price action from succeeding on consecutive days.
The Ichimoku Cloud maintains a nervous atmosphere. The price remains close to the lower edge, suggesting a sense of indecision rather than strength.

The look-ahead cloud remains red, indicating the bear’s strength is still present. The lagging line is still below the price, suggesting weakness in an upside move and suggesting resistance around $0.11.
In the short term, Dogecoin is trading in a tight range of $0.095 to $0.098. This indicates a decline in volatility following the recent drop.
According to the TradingView chart, if Dogecoin breaks above $0.10, there is a possibility of a price increase to $0.112. However, if the price fails to hold onto its support, there is a possibility of a decline to $0.094 and then to $0.072.
Momentum indicators are suggesting that the early stages of the rebound are vulnerable. The RSI (14) is currently at 52.00, and the signal average is at 49.24, which is neutral to mildly positive. The move up from oversold levels indicates increasing strength, although it remains limited.

The MACD is at 0.00031, while the signal line is at -0.00071. The histogram is at -0.00102. This suggests a budding bullish crossover.
However, the negative histogram suggests that this is yet to be confirmed. In order to have a solid bullish signal, the MACD and the histogram need to rise.
Dogecoin is trading at around $0.10, a crucial price point at which a breakout could trigger further bullish sentiment.
If this price point continues to hold, it could bode well for the price; otherwise, a bearish sentiment could prevail.
Also Read: Dogecoin Eyes Major Breakout: Could DOGE Hit $2.00 in 2026?

