
Dogecoin is struggling to regain upward momentum as recent market data shows the meme coin facing strong technical resistance.
On March 7, crypto analyst Trader Tardigrade highlighted a bearish setup on the 4-hour chart of Dogecoin using the Ichimoku indicator.
Dogecoin attempted to rise but was unable to rise above the Ichimoku cloud, priced at $0.102 and $0.103. The selling pressure caused the price to fall, and the Ichimoku cloud was a resistance for the asset.
It suggests a swift liquidity sweep before the price resumes the downtrend. The price fell below the Ichimoku Tenkan-sen and Kijun-sen lines.
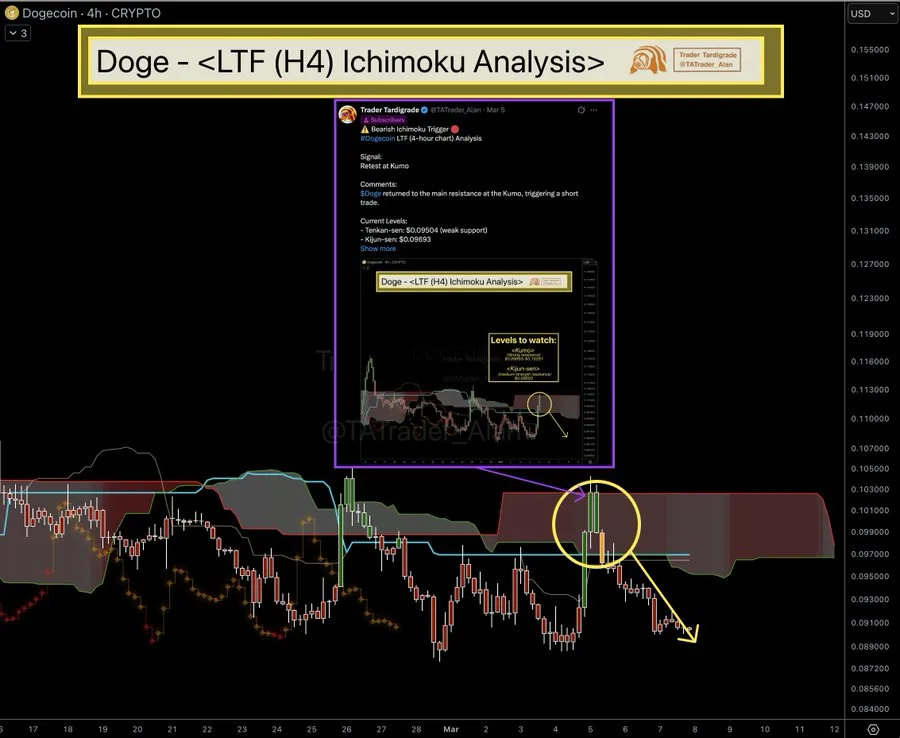
Source: X
The Tenkan-sen around $0.095 is offering weak short-term support, but the Kijun-sen around $0.096-$0.097 is a stronger balance support prior to the latest fall.
The cloud in front looks very thick, indicating strong resistance for any recovery unless there is strong buying interest.
Also Read: Dogecoin Plummets to $0.094: Could DOGE Surge to $3 Next?
The broader trend, however, indicates that DOGE is still in a weak position. As per the analysis from TradingView, as of March 7, Dogecoin was in a downtrend in the long term, as evidenced by its price chart over the daily interval.
At the time of analysis, DOGE was trading at $0.0898 and was still trading below all major exponential moving averages.
The 20-day EMA is around $0.0955, the 50-day EMA is around $0.1052, the 100-day EMA is around $0.1226, and the 200-day EMA is close to $0.1486.
The shorter EMAs being below the longer EMAs indicate a downward momentum. It also indicates that the short-term and the long-term trends are in favor of the sellers.

Source: TradingView
The price action since November has been clear, with Dogecoin making lower highs and lower lows, which is a clear indicator of an ongoing downtrend. The bounces have been stopped at the levels of the moving averages, which are the resistance levels.
The $0.095 to $0.105 range has now become a major resistance zone. If the price breaks through this zone, it could potentially go up to the 100-day EMA at $0.122.
Dogecoin is still holding up, but it is getting close to an important support area. In the past, the demand has shown that the price may receive support between $0.085 and $0.080 in the short term.
If this support level fails, the price will be headed towards the next level, which is $0.076. This may cause the price to drop faster since it is breaking through an important support level.
The momentum indicators are also behaving in a cautious manner. The Relative Strength Index is ranging from 41 to 42, which is below 50. This indicates that the asset is still facing selling pressure, but it is not yet oversold.
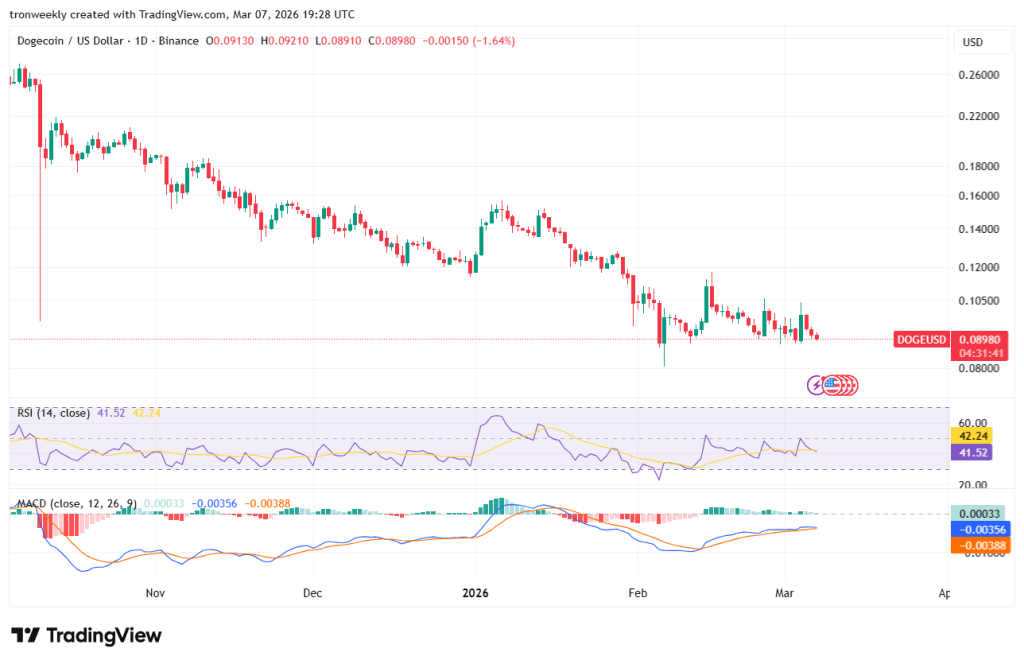
Source: TradingView
The MACD indicator also indicates that the asset is still in a weak state. The histogram indicates a fall in the bearish momentum, but the MACD line is still below the zero line.
Also Read: Dogecoin Mirrors 2021 Cycle: Could DOGE’s Next Cycle Ignite a $5 Rally?

