$DOGE began the session at $0.240, rallied to $0.248, then plunged during heavy U.S. trading hours, hitting a low of $0.223. A late rebound lifted the price back to $0.226, indicating that buyers were accumulating near the support zone. Notably, volume during the sell‑off spiked to 918 million, more than 2× the 24‑hour average. This indicates that large players may have triggered stop‑loss orders, which could create a base for recovery if demand returns.
Looking at the past 7-days, the chart looks even grimmer, with more than -18% losses.
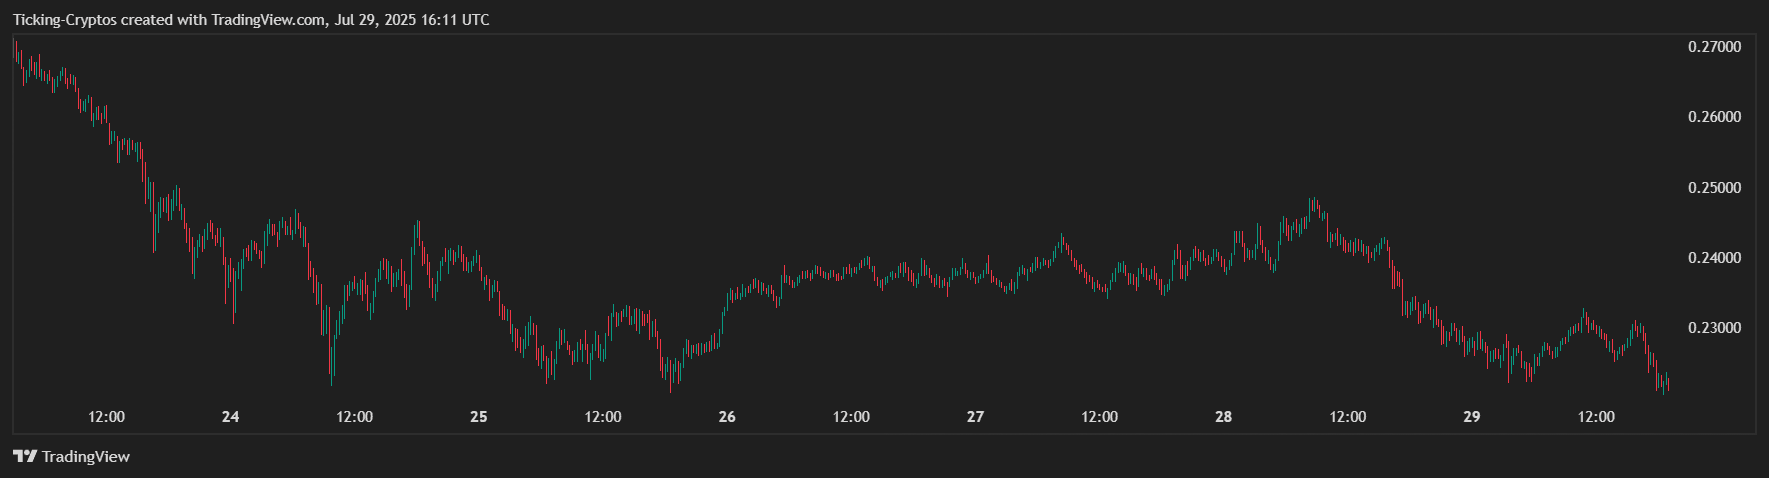
DOGE/USD price chart in the past week - TradingView
| Level | Significance |
|---|---|
| $0.248 (recent high) | Short‑term resistance; failure to sustain rally triggered the sell‑off. |
| $0.240–$0.241 | Key resistance zone—needs to break for bullish reversal. |
| $0.223–$0.225 | Strong support tested twice; heavy volume suggests accumulation. |
| $0.215–$0.218 | Next support if $0.223 fails. |
Given the heavy sell‑off and subsequent bounce from the $0.223 area, the near‑term outlook is cautiously optimistic. If DOGE holds above $0.223 and can reclaim $0.241, the price could retest $0.260 within days. However, failure to maintain support may send it toward the $0.215–$0.218 range. Investors should monitor U.S. inflation data and Federal Reserve commentary, as macro headwinds may prolong volatility.
For live pricing and charts, visit the DOGE price page.

