ETH moved alongside a broader crypto-market rally, rather than on an Ethereum-only catalyst. The immediate technical question is whether buyers can turn the reclaimed $1,985-to-$2,002 area into support and push through $2,109.
The rally carried ETH above two closely grouped levels: the 0.5 Fibonacci retracement at $1,985 and the 200-day simple moving average at $2,002. That makes the $1,985-to-$2,002 range the first area buyers need to protect during any pullback.
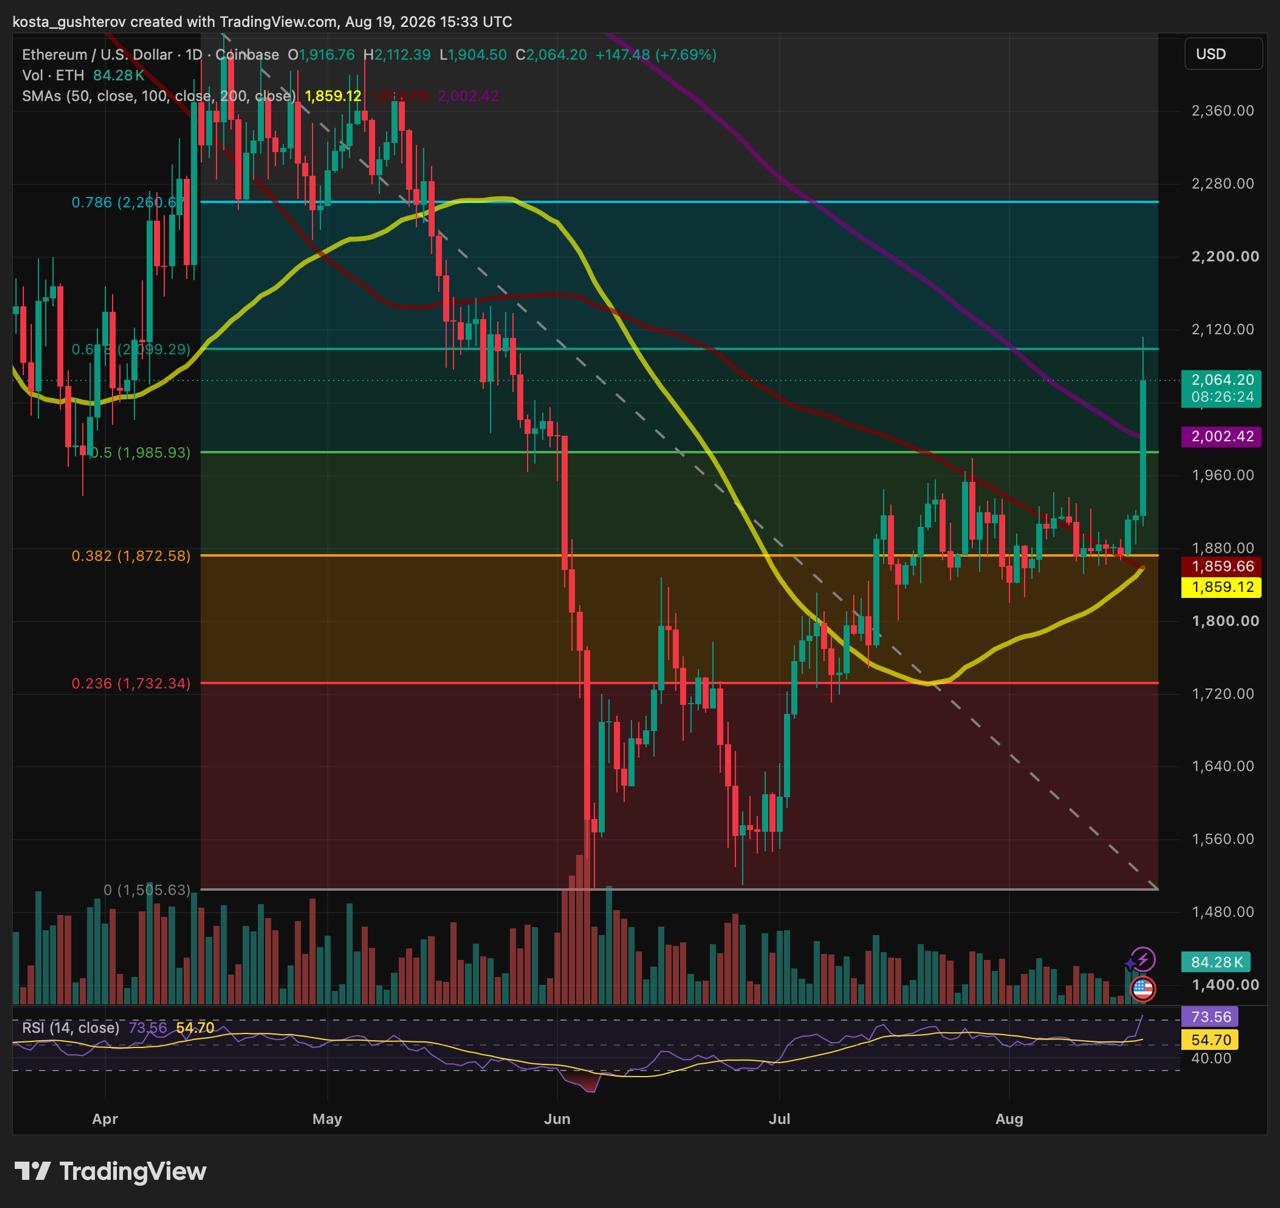
The chart’s next Fibonacci level sits at $2,110. ETH traded slightly above that mark during the session, reaching $2,112., but was back near $2,064 in the supplied chart. A daily close above $2,109 would put the 0.786 retracement at $2,260 into view.
| Level | Why it matters |
|---|---|
| $2,266 | 0.786 Fibonacci retracement; next upside level after a confirmed close above $2,109. |
| $2,110 | 0.618 Fibonacci retracement and the immediate breakout barrier. |
| $2,002 | 200-day SMA; reclaimed during the rally. |
| $1,985 | 0.5 Fibonacci retracement; now part of the nearest support zone. |
| $1,872 | 0.382 Fibonacci retracement; first lower support if $1,986 fails. |
| $1,860 | 50-day and 100-day SMA cluster. |
The supplied CoinGlass ETH flow panels showed positive net flows in both futures and spot markets. Futures activity, however, was much larger.
| Period | Futures turnover | Spot turnover | Futures net flow | Spot net flow |
|---|---|---|---|---|
| 1 hour | $12.17 billion | $881.40 million | +$1.45 billion | +$51.82 million |
| 24 hours | $23.48 billion | $1.64 billion | +$1.92 billion | +$51.61 million |
Futures turnover was about 13.8 times larger than spot turnover over one hour and roughly 14.3 times larger over 24 hours. On CoinGlass’ methodology, positive net inflow means aggressive buy volume exceeded aggressive sell volume during the period.
That points to a derivatives-heavy move: futures traders supplied most of the activity behind the advance, while spot buying was positive on a much smaller scale. This structure can accelerate an upside move when leveraged traders chase price or close short positions. It can also leave ETH more sensitive to a sharp reversal around resistance, because futures flow alone does not show whether the buying came from fresh long positions, short covering, or both.
The immediate test is $2,110. A daily close above that level would strengthen the case for a move toward $2,265. A rejection followed by a loss of the $2,002-to-$1,986 support zone would shift attention to $1,873 and the $1,860 moving-average cluster. Stronger spot participation alongside the futures flow would give the advance a firmer base.
Source review: Price levels, moving averages and Fibonacci levels are based on the supplied TradingView ETH/USD daily chart, captured at 15:33 UTC on August 19, 2026. Flow figures are from the supplied CoinGlass ETH futures and spot panels. Turnover figures are calculated as inflow plus outflow. The article is provided for informational purposes only and does not constitute investment advice.
The post Ethereum Pumps 8%, Reclaims $2K as Futures Flows Surge appeared first on Coindoo.





