
Ethereum does not appear to have a clear direction as it attempts to recover from the ongoing selling pressure in the cryptocurrency market. Price is currently trading at key support and resistance levels, indicating continued uncertainty about Ether’s near-term direction.
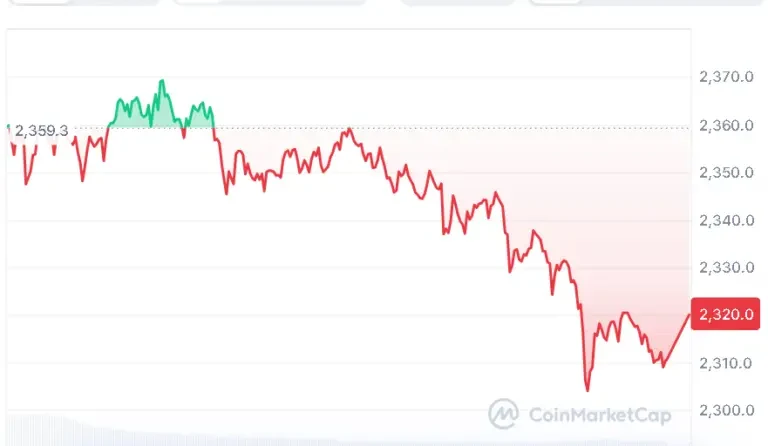
At the time of writing, Ethereum is trading at $2,320, with a 24-hour trading volume of $21.08 billion and a market capitalization of $278.66 billion, according to CoinMarketCap. Over the past 24 hours, ETH has declined by 1.32%.
Also Read | Solana (SOL) Holds Support as Correction Signals Move Toward $95
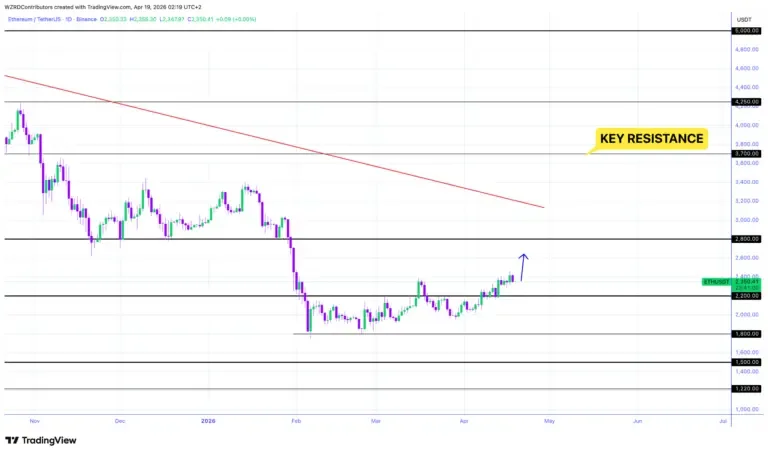
On April 19, 2026, crypto analyst CRYPTOWZRD made an update on the current market trend, stating that Ethereum was trading bearishly. However, if Ether can manage to sustain itself above the level of $2,380 intraday resistance, there is a chance for recovery and possible long entries.
It is also indicated that both Ethereum and ETH/BTC ended on the low side. If Bitcoin’s dominance decrease, Ether could be boosted. Breakout from the ETH/BTC trendline will take the price towards 0.0325 BTC. Support levels: $2,200, while the resistance level is seen at $2,800.
In the short term, the intraday technical picture for Ethereum looks rather weak since the price is still trading below $2,380. Unless this area can be captured, one can expect an unsteady and ranging environment. Meanwhile, if a breakout occurs from the current resistance level, a stronger bullish push might follow.
Technical indicators suggest an overall positive stance on Ethereum. The RSI indicator is close to the level of 56.08, reflecting strong performance yet not placing itself into the zone of overbuying.
ETH trades above both the 20-day SMA of $2,223 and the 50-day SMA of $2,136, which implies that there is some sort of a recovery pattern; however, it trades under both the 100-day SMA of $2,303 and the 200-day SMA of $2,856.

The MACD is still positive, the MACD line is still above the signal line, and a green histogram is seen at 12.63, indicating continued buying but less buying strength. But since there is no confirmation yet from the momentum, it seems that Ethereum will continue to consolidate.
Overall, Ethereum stands at a pivotal point from a technical perspective. The immediate future of Ethereum depends on how well it manages to break out of the resistance level of $2,380 and the support level of $2,200.
This article contains market analysis and price predictions. These are not guarantees. Crypto markets are volatile. Always DYOR. Not financial advice.
Also Read | Bitcoin Faces $75,846 Test as Momentum Weakens Amid Controlled Pullback

