Ethereum has been under pressure recently after a strong rally that took the price to nearly $5K. While the uptrend remains intact on the higher timeframe, the recent rejection and sharp pullback have raised concerns about a deeper correction.
This price action has led to a change in market tone, with traders closely watching key support zones to determine whether this is just a dip or the start of a broader trend shift.
By Shayan
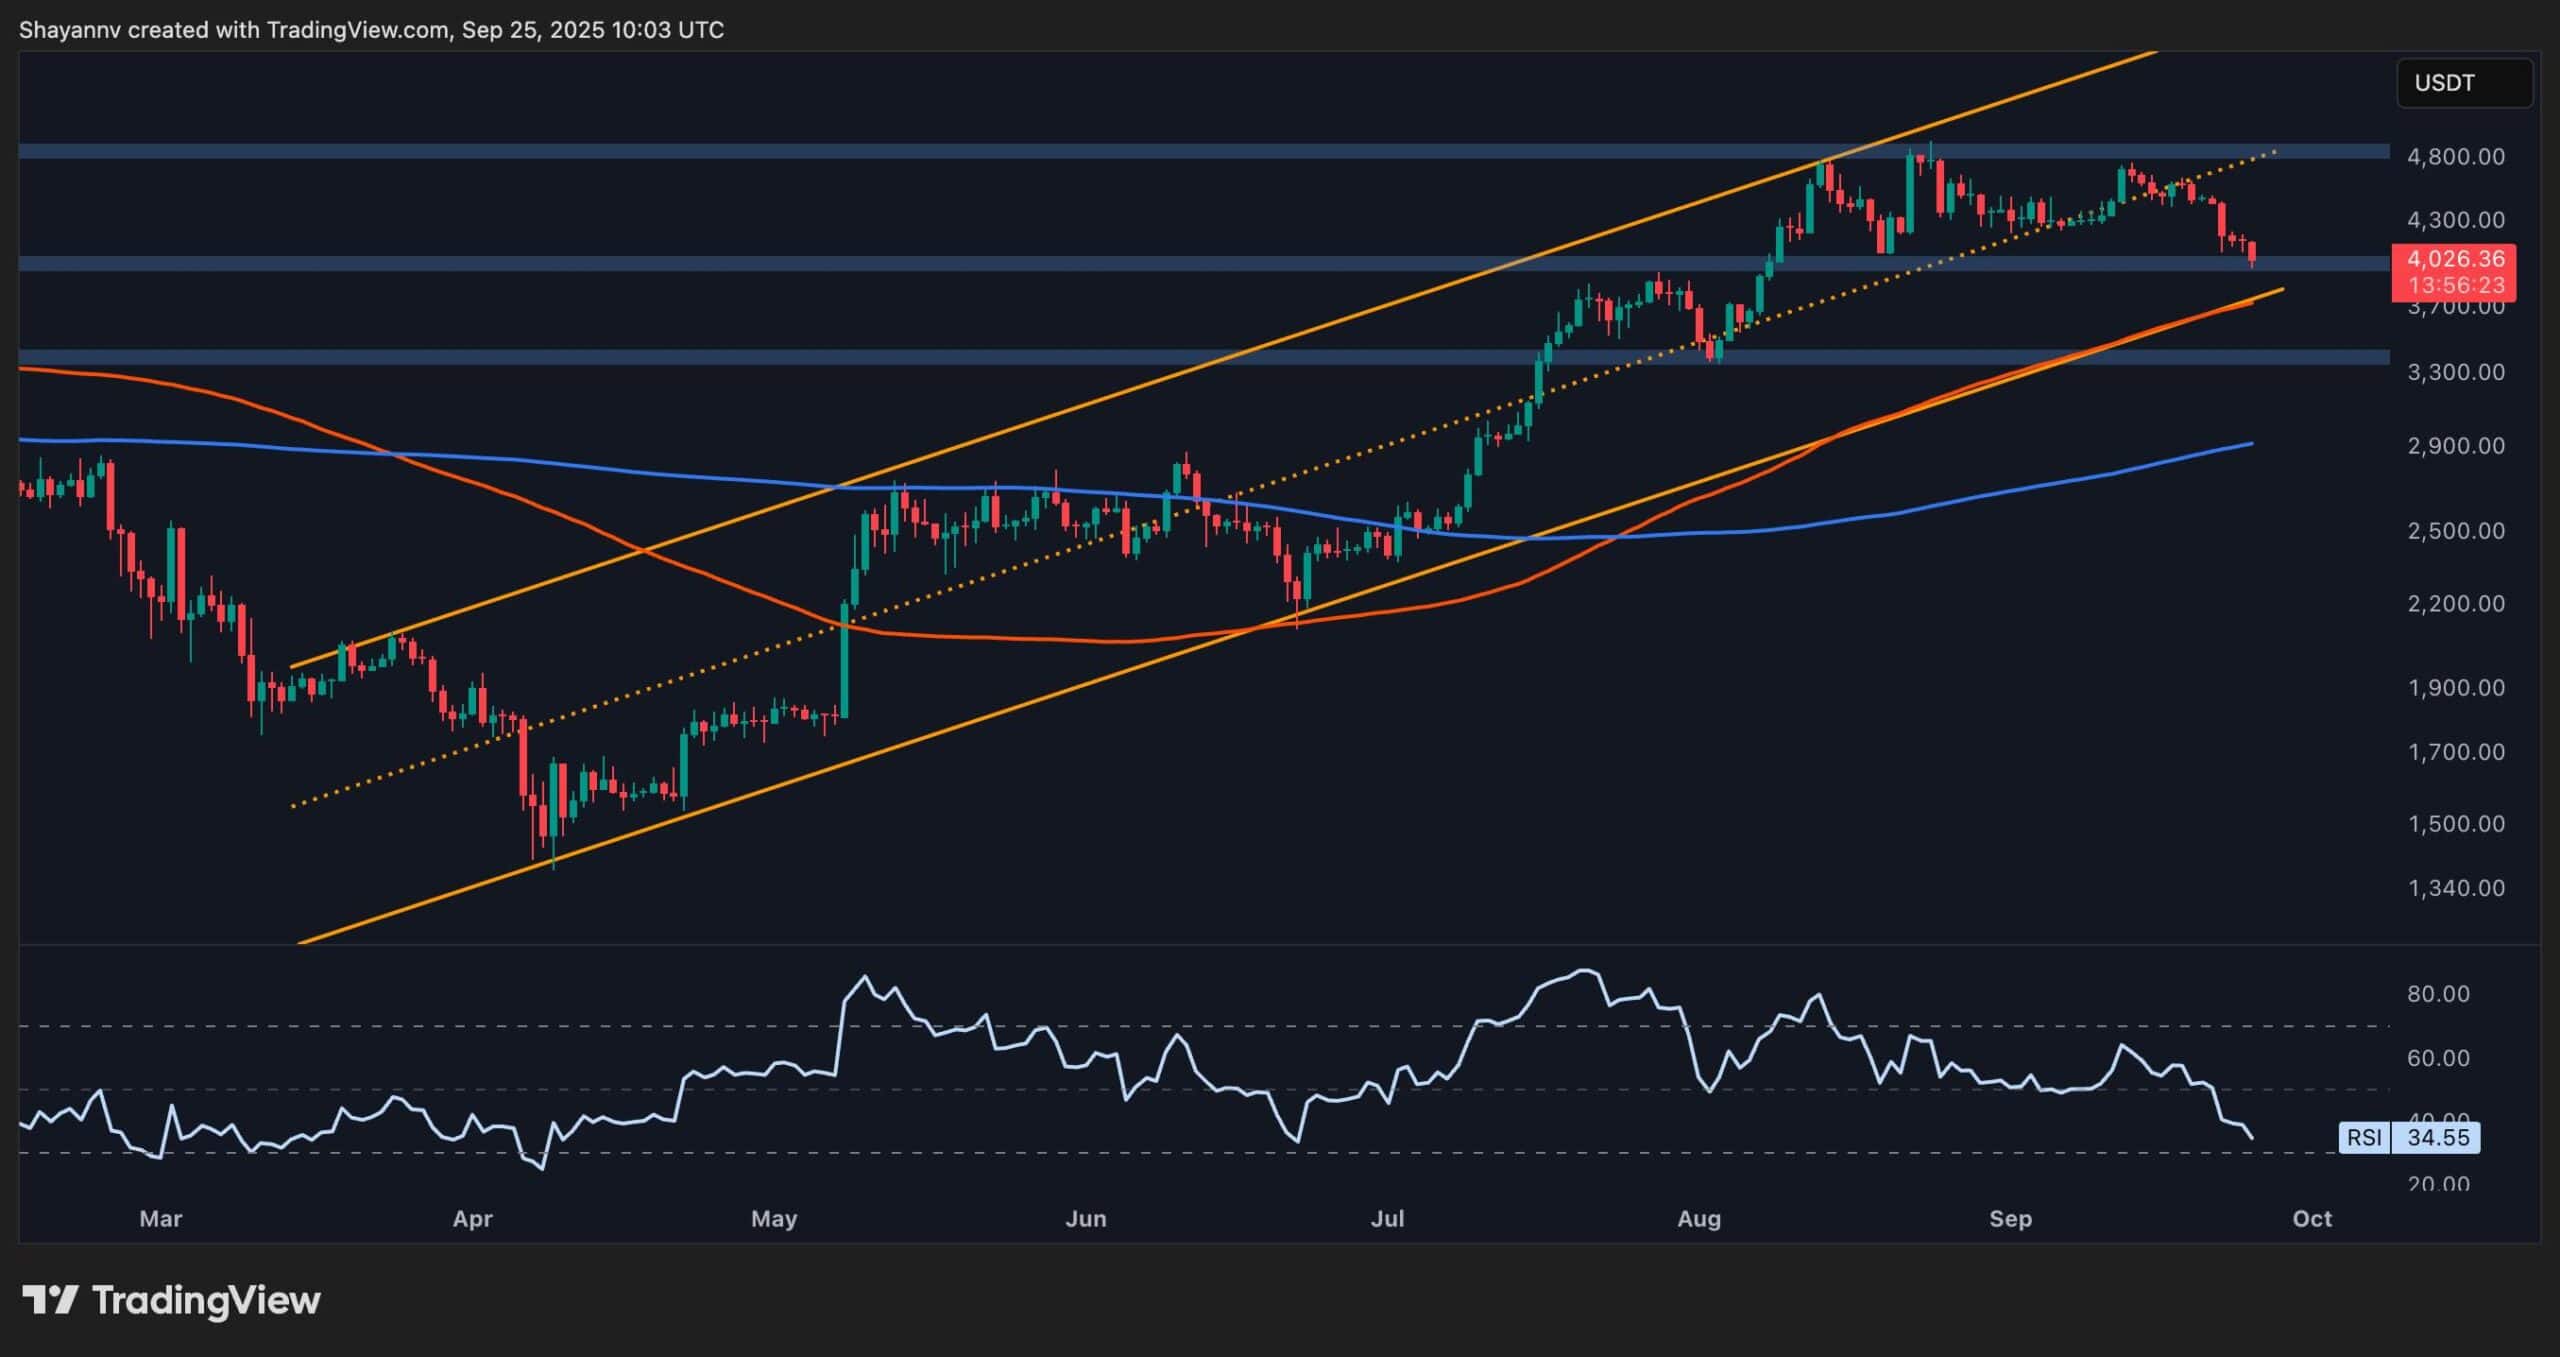
On the daily timeframe, ETH had been climbing inside a clean ascending channel since April, making higher highs and higher lows. However, the recent drop broke below the mid-channel trendline, and the asset is now hovering just above the lower boundary of the channel.
The $3.9K–$4K region is a strong confluence zone, supported by a horizontal demand zone, the 100-day moving average, and the lower boundary of the channel. If this level breaks, the next support lies around $3.4K, followed by the 200-day moving average, which is now located at around $2,900.
The RSI has also dropped to 34, suggesting that bearish momentum is increasing, but ETH is also approaching oversold conditions, where a bounce becomes more likely.
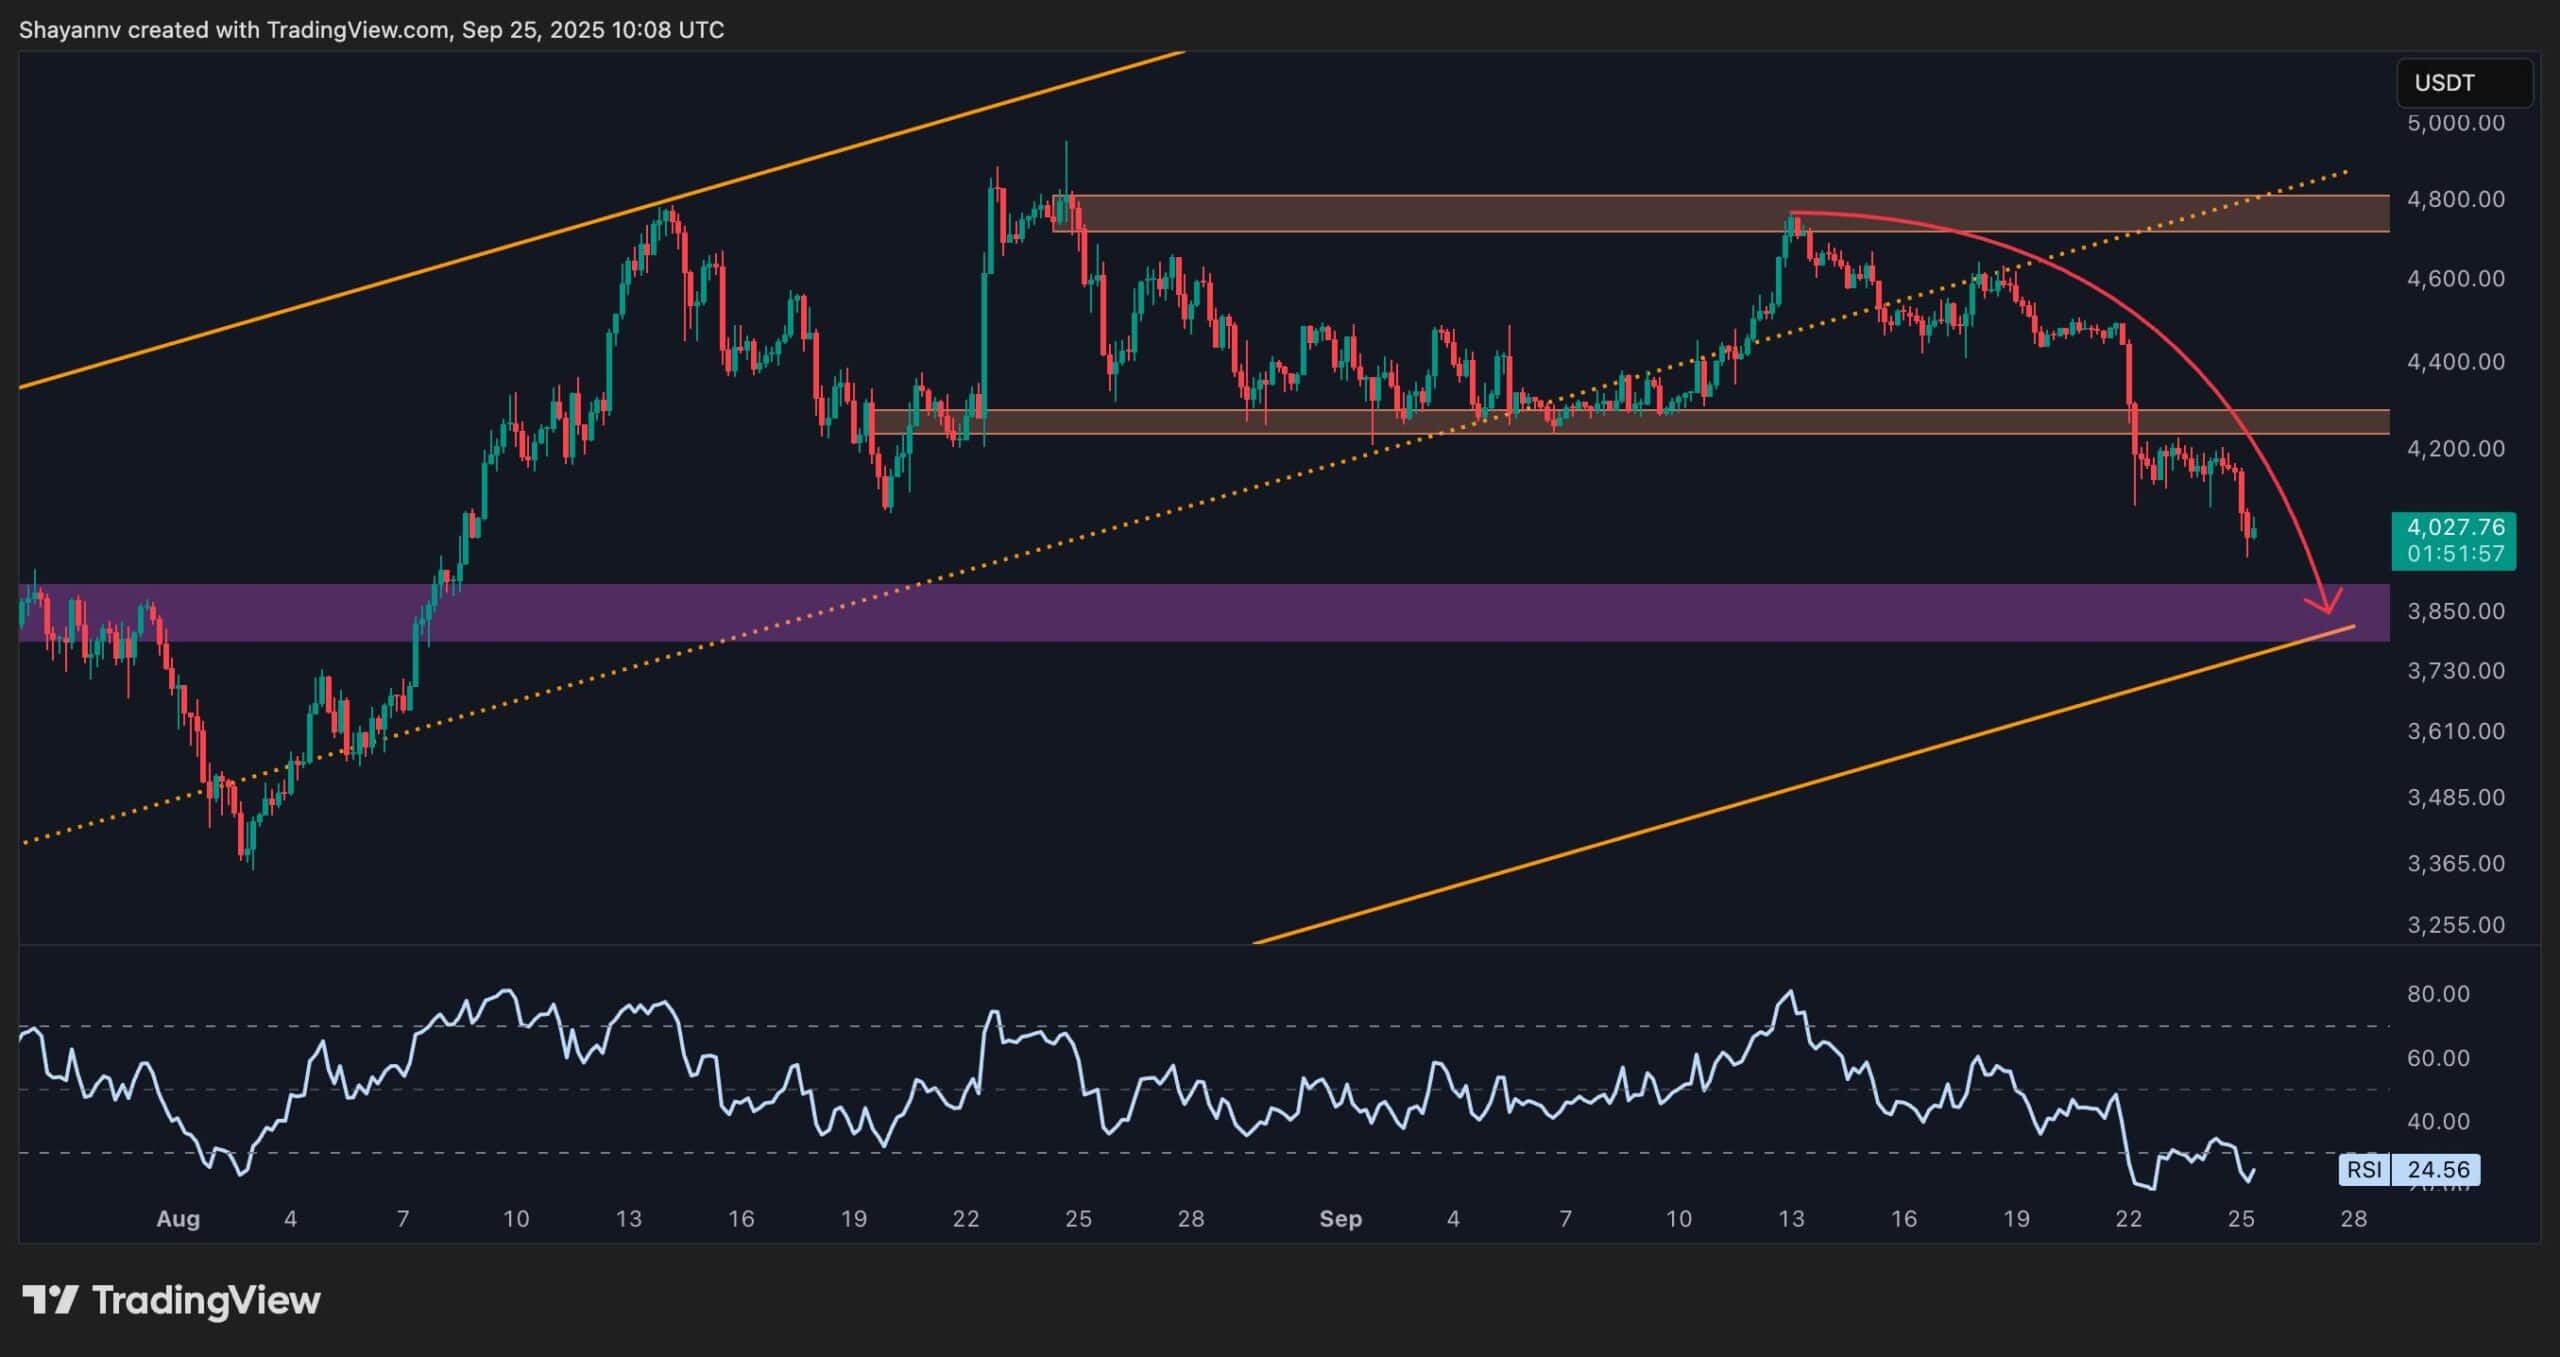
Zooming into the 4-hour timeframe, the structure looks clearly bearish in the short term. The price has broken below a key support at $4.2K and is currently following a parabolic correction path. Momentum is weak, and the RSI is deeply in the oversold region, sitting near 24, which could lead to a relief bounce soon.
That said, unless ETH reclaims the $4.2K–$4.3K area and forms a local higher high again, the bias remains bearish. All eyes are now on the $3.8K-$4K zone, a critical level that could either trigger a strong rebound or open the doors for a further drop toward $3.5K or even lower.
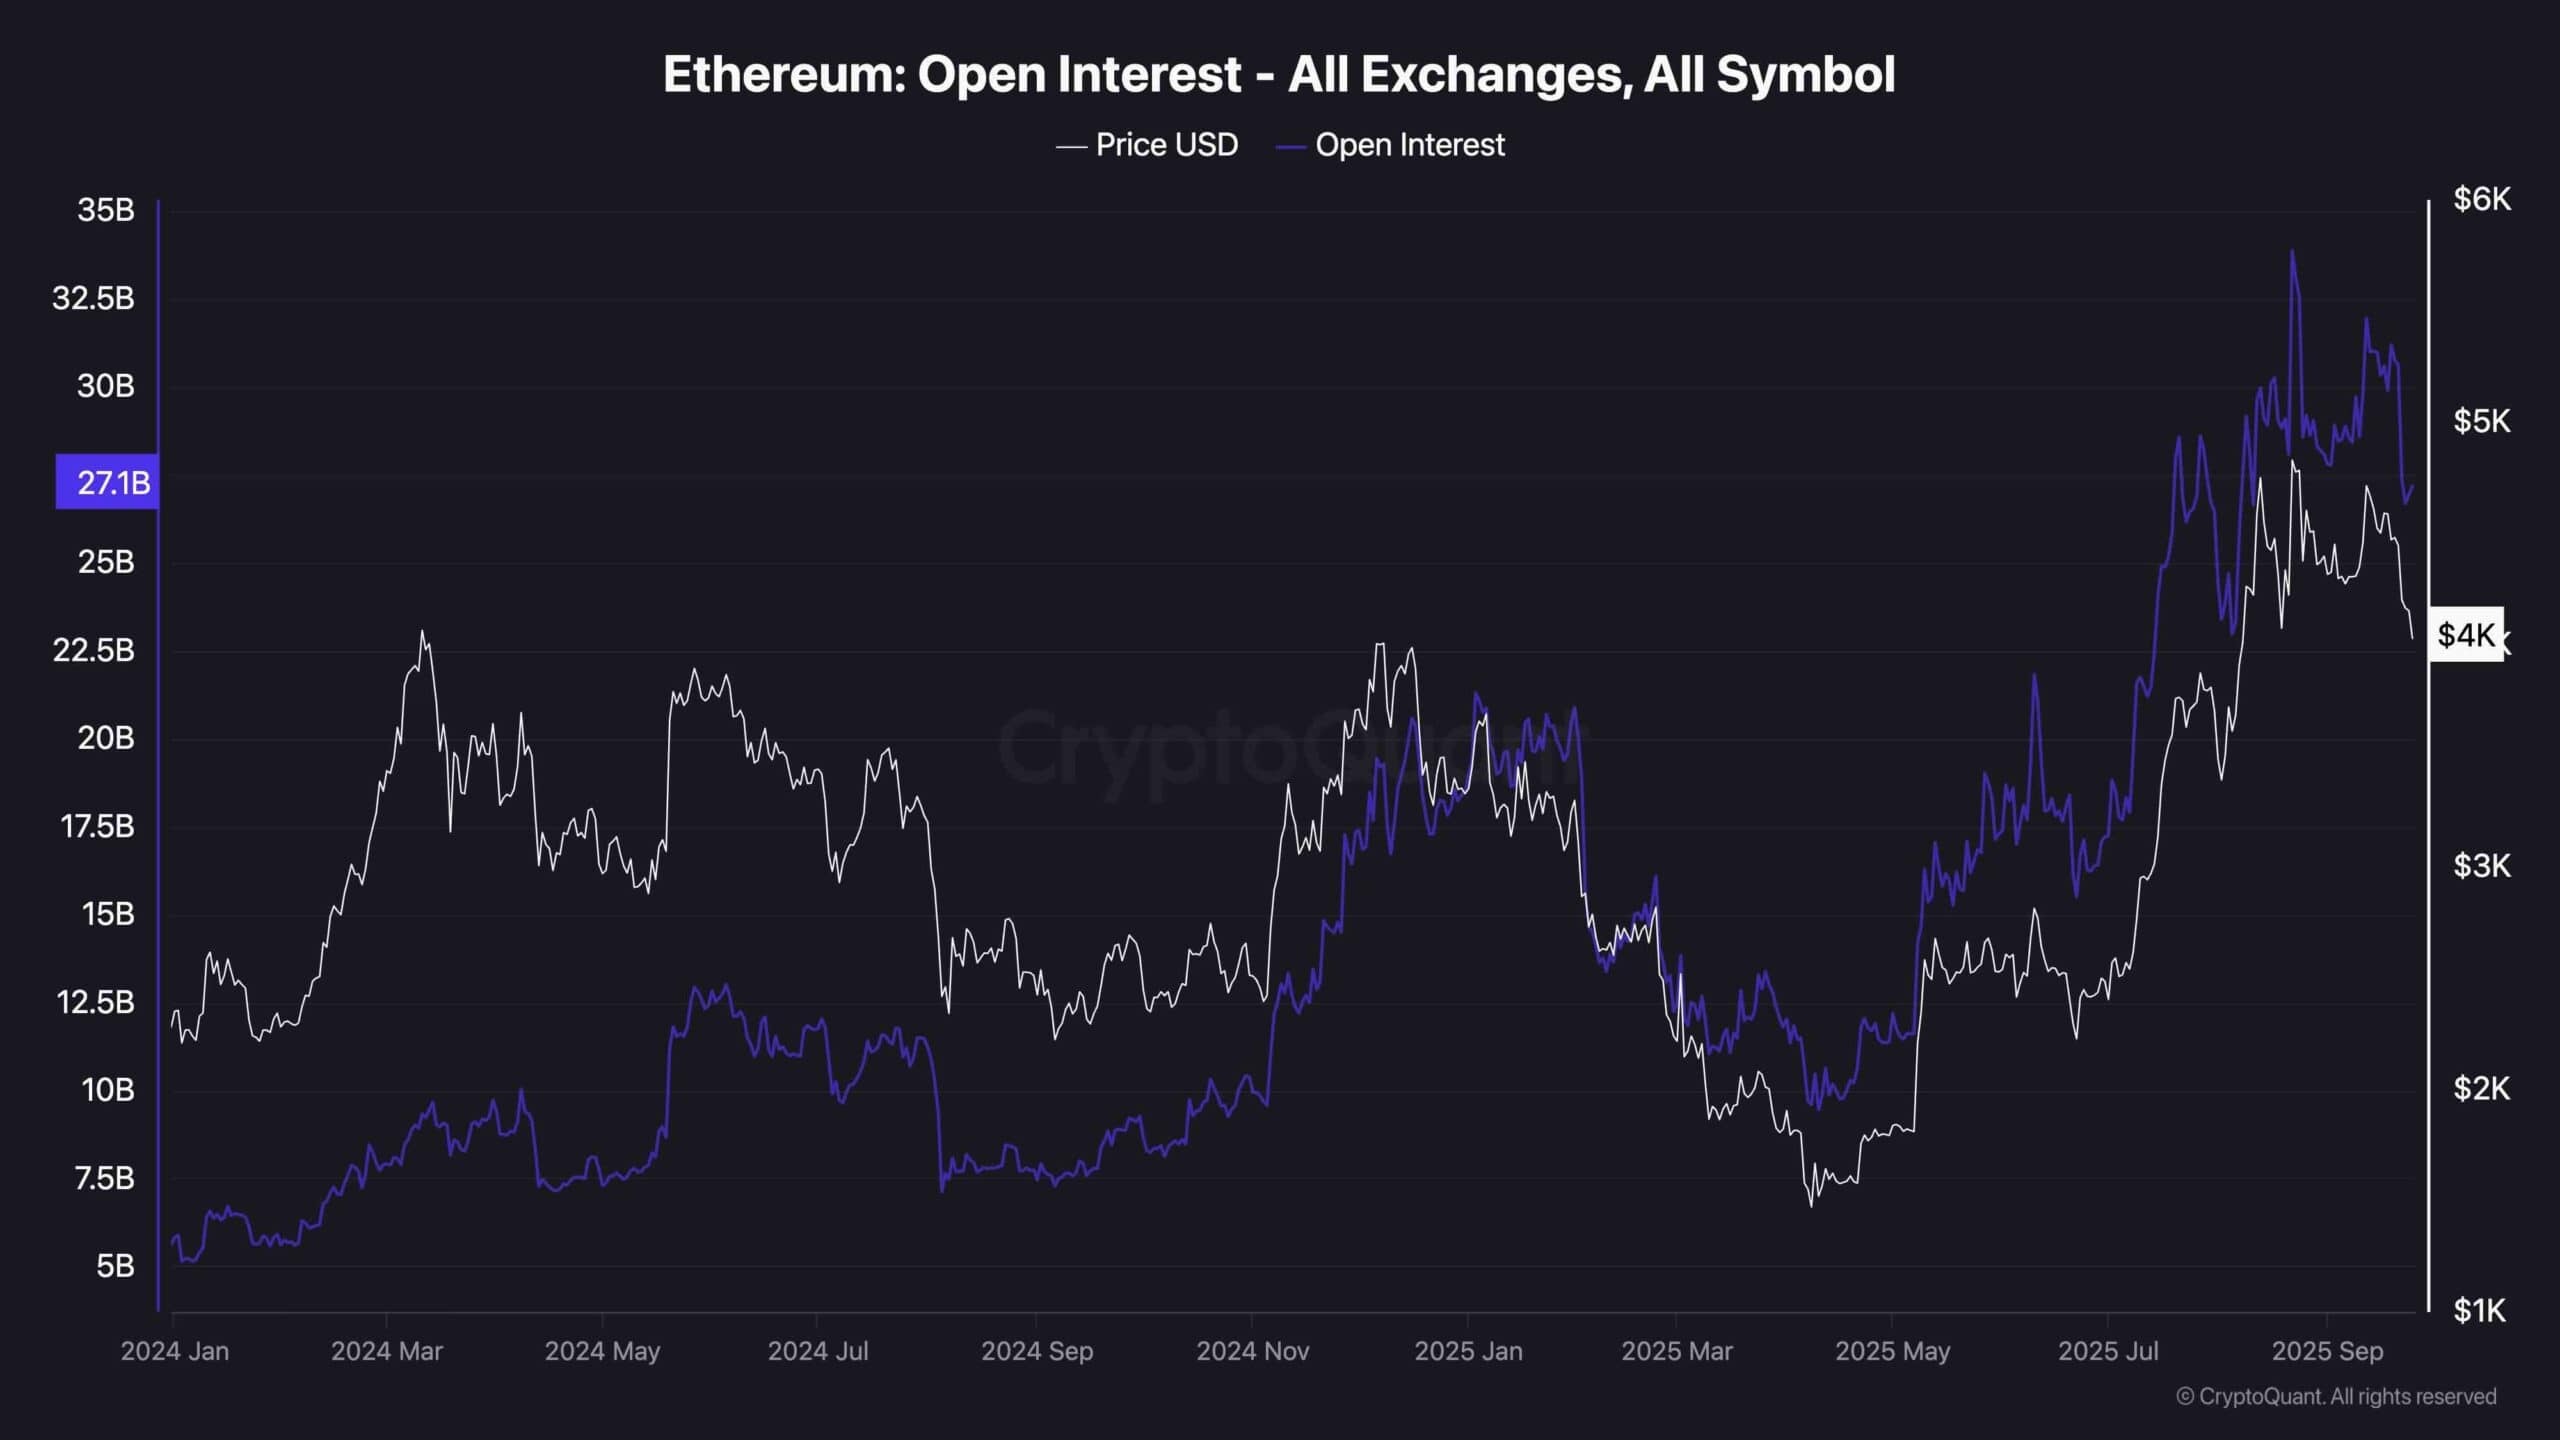
Ethereum’s open interest has dropped significantly following the recent price decline, showing that many leveraged long positions have been wiped out during this correction. However, despite the pullback, open interest remains elevated compared to earlier this year.
This suggests there’s still a considerable amount of speculative activity in the market. The sharp reduction in OI signals reduced the immediate risk of a major liquidation cascade, but the elevated baseline indicates traders are still positioning for volatility. If price stabilizes around key support and sentiment improves, we could see OI climb again alongside a potential bounce.
The post Ethereum Price Analysis: How Low Can ETH Go if $4K Support Is Permanently Lost? appeared first on CryptoPotato.


