
Ethereum has opened July with a new monthly TD Sequential buy signal, adding a technical reversal setup to a market still trading near recent lows.
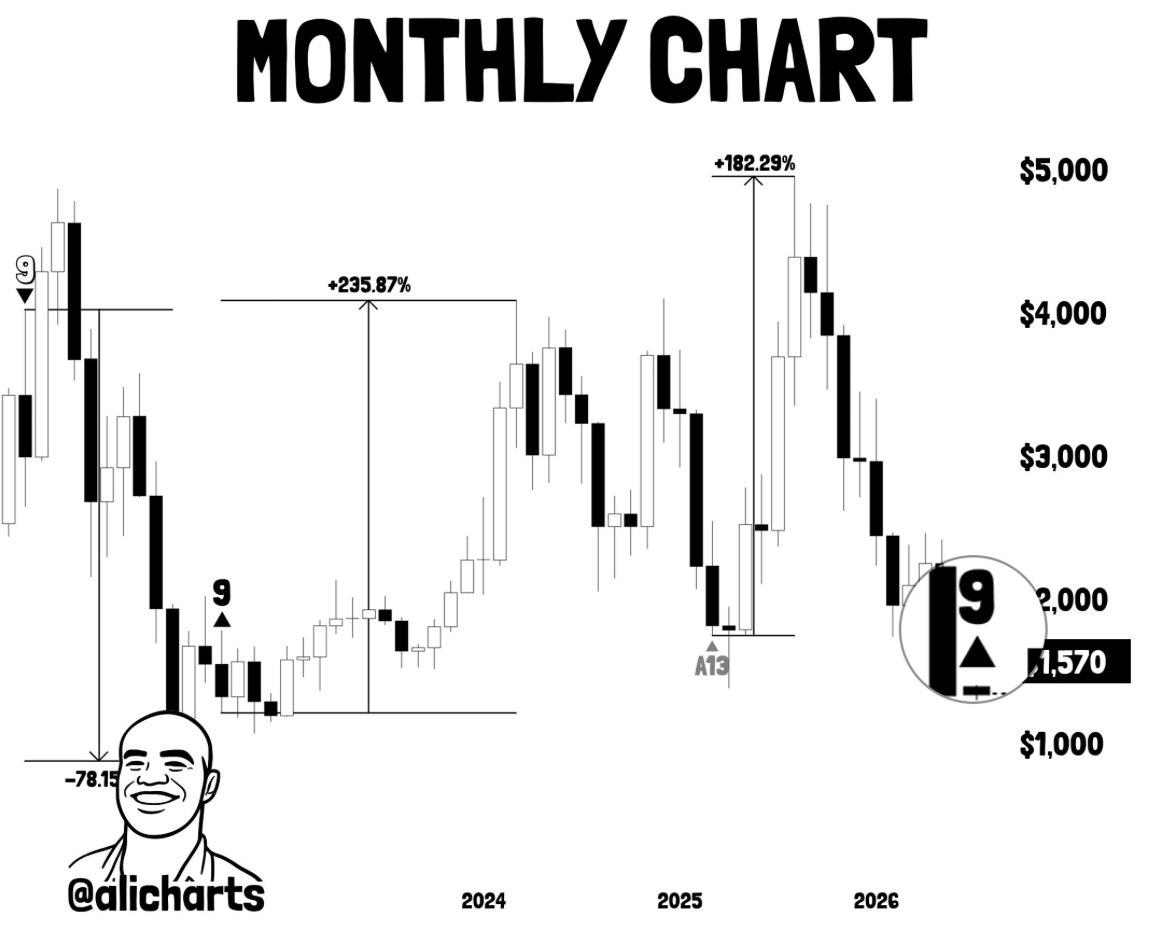
Ali Martinez flagged the Ethereum monthly signal, saying the Tom DeMark Sequential indicator printed a buy trigger on ETH’s monthly chart. The signal appeared after Ethereum traded through a weak June and remained near the lower end of its 2026 range.
ETH recently traded near $1,625, with an intraday range between about $1,596 and $1,638. The token remains above the late-June levels that kept traders focused on the same downside area after Ethereum broke below $1,825 support.
The TD Sequential is a technical indicator used by traders to track possible trend exhaustion after extended moves. A monthly signal carries a longer timeframe than daily or weekly setups, but the new July candle can still move sharply before the monthly close is finalized.
Martinez tied the latest ETH signal to three earlier monthly TD Sequential events. His chart marked a September 2021 sell signal before Ethereum’s cycle decline, a September 2022 buy signal before a major rebound, and a March 2025 buy signal before ETH’s next expansion.
Those historical examples make the new signal relevant for traders watching whether Ethereum’s selloff is losing momentum. The setup does not confirm a cycle bottom or guarantee a price recovery. It marks a technical condition that has appeared near prior ETH turning points on the same monthly timeframe.
Ethereum has also been trading under pressure from weak risk appetite, reduced speculative flows and volatility across crypto-linked equities. The same market stress recently kept ETH near recent lows when the Winklevoss-linked BTC and ETH transfer drew attention during a broader drawdown in major crypto assets.
The new technical signal lands as Ethereum demand remains split across spot trading, ETF flows, staking economics and public-company treasury buying. BitMine recently added another 27,084 ETH, lifting its treasury to 5,700,040 ETH and 4.7% of Ethereum’s supply.
That treasury demand has not removed ETH’s price pressure. Ethereum still needs sustained spot demand and cleaner market structure before traders can treat the monthly signal as more than a reversal attempt.
The next confirmed data point is the July monthly close. As of July 2, Ethereum traded near $1,625, with Martinez’s TD Sequential signal active on the newly opened monthly candle.
The post Ethereum Monthly Chart Flashes TD Sequential Buy Signal appeared first on Crypto Adventure.

