$Ethereum has quietly put together one of its strongest months of 2026. ETH tagged $1,980 in early European hours on July 27, a level it had not seen in 55 days, and is now trading around $1,958 after a marginal pullback. Zoom out and the move is bigger than it feels: ETH bottomed near $1,540 in late June and has gained roughly 30% in 30 days.
The rally has been methodical rather than explosive. Higher lows since July 1, a clean break of $1,800 in mid-July, and now a direct test of the psychological $2,000 barrier. The question for traders is whether this is the start of a genuine trend expansion or the final leg of a relief rally into heavy supply.
The 3-hour chart tells a clean story in three phases.
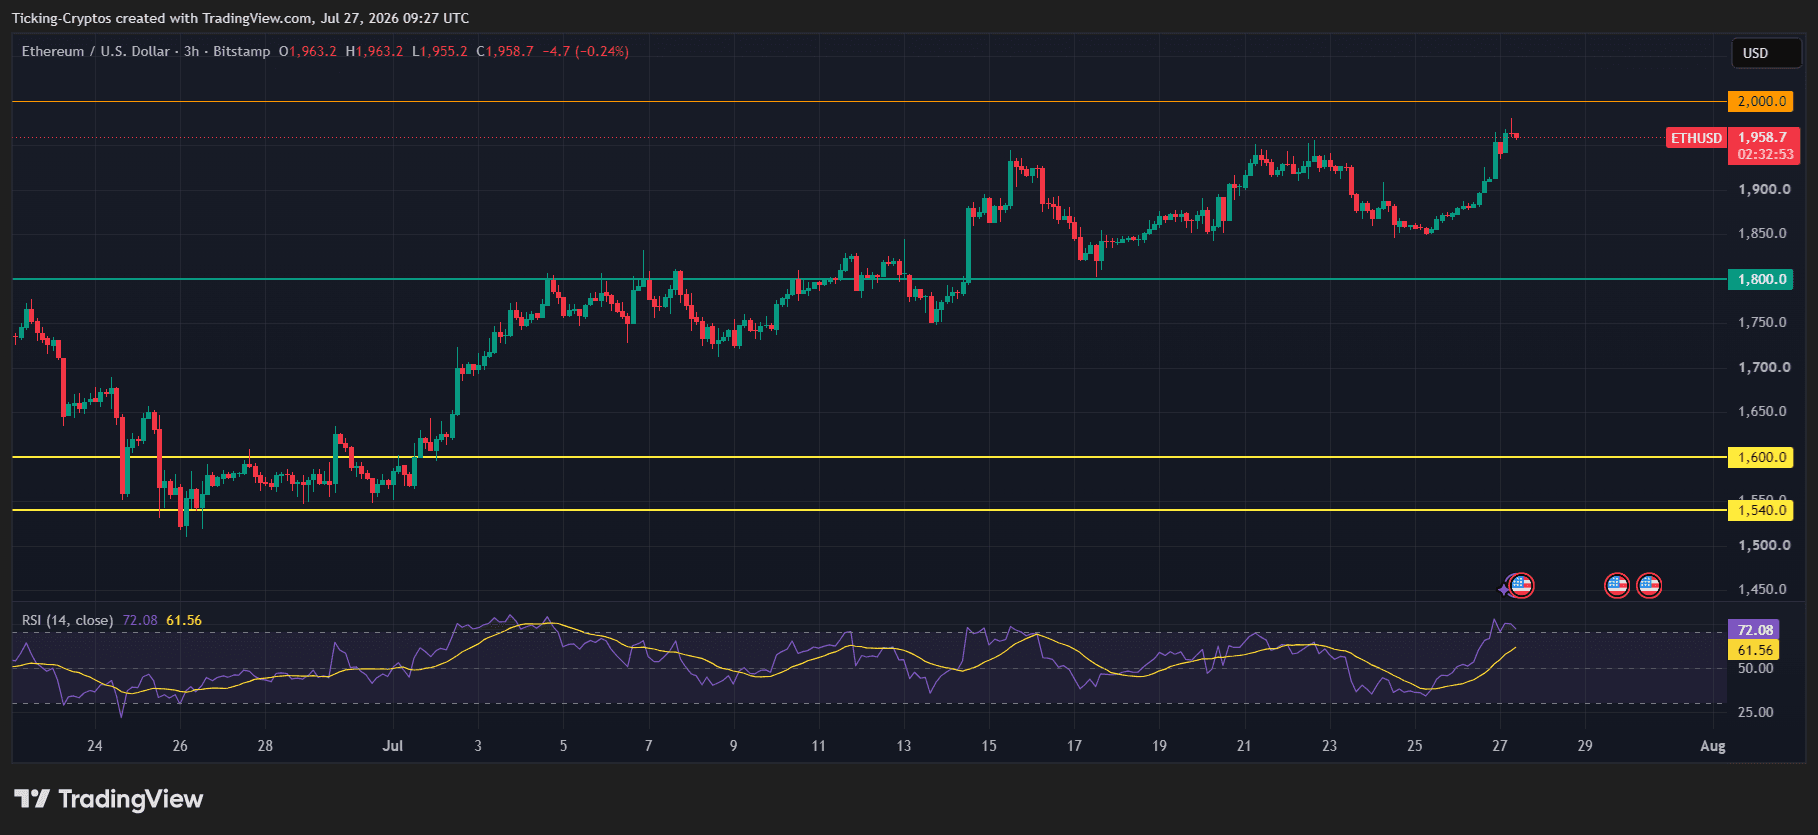
The structure is intact: higher highs, higher lows, and a flipped support level holding on every retest. Nothing on this chart is broken.
The 14-period RSI sits at 72.08, comfortably above its 61.56 signal line. That is technically overbought territory, and it is the first thing bears will point to.
Context matters here. RSI above 70 in a downtrend is a sell signal. RSI above 70 in a confirmed uptrend is a momentum confirmation. Look at what the oscillator did during this move: it peaked near 78 in early July and price kept climbing for three more weeks. More importantly, RSI never broke below 40 on any of the pullbacks. That is the signature of a bullish regime, not an exhausted one.
The caveat worth flagging: price has made a higher high at $1,980 while RSI is reading lower than its early-July peak. That is a mild negative divergence. It does not invalidate the trend, but it does suggest the next leg needs fresh buying rather than momentum alone.
Worth noting: prediction markets earlier this month priced only a 32% chance of ETH touching $2,000 before July closes. That positioning is now badly offside, which is exactly the kind of setup that produces squeeze candles.
Bulls have three lines of defence, in order:
Below that, $1,600 and then the $1,540 base are the last stops. A return there would mean the whole 30% move was a bull trap, which the current structure does not support, but it is the map you want if things break.
The chart shows US macro event markers clustered on July 27, 29 and 30, and they matter.
The FOMC announces its rate decision on Wednesday, July 29 at 2:00 PM ET, following a two-day meeting. Consensus is for another hold in the 3.50% to 3.75% range, so the reaction will hinge on the statement language and the press conference rather than the number itself. Any hint of a more accommodative stance would be fuel for high-beta assets like ETH.
On top of that, a wave of mega-cap tech earnings lands in the same week, which tends to drive broad risk sentiment. Crypto has been trading with a high correlation to the Nasdaq for most of 2026.
The underlying bid, though, looks structural rather than macro. Spot ETH ETF flows have held up through the consolidation, staking participation is at record levels, and ETH's market cap has climbed back to roughly $237 billion. Those are slow-moving drivers, and they are the reason this rally has been a grind rather than a spike.
Ethereum is in a confirmed short-term uptrend testing the most watched round number on its chart. The bull case needs a decisive close above $2,000 to open $2,070 and then $2,150. The bear case needs a loss of $1,845 to stall the move and $1,800 to end it.
The asymmetry currently favours the bulls, but $2,000 is a level that rarely breaks on the first attempt.





