
With the fear of losing further, the trading conditions of the crypto assets are mixed in green and red shades. With the majority of the tokens losing momentum, the largest asset, Bitcoin (BTC), is hovering around $110.9K. Meanwhile, the largest altcoin, Ethereum (ETH), has been stuck in the bear trap for the last few days.
ETH opened the day trading at around a bottom range of $4,344.41. Later, the bulls led price movement shifted the trading pace, and the asset jumped to a high of $4,489.20. To assure the bullish presence, the price has broken the key resistance range between $4,349 and $4,484.
The altcoin has registered a spike of over 0.55%, and at the time of writing, it traded within the $4,405 mark. Ethereum’s daily trading volume has reached $36.43 billion after a brief drop. In addition, the market has seen a liquidation of $62.40 million worth of Ethereum, as reported by the Coinglass data.
Significantly, the Ali chart displays that Ethereum is showing weakness after its recent drop from the $4,480 zone. If it fails to hold above $4,380, it could consolidate sideways before dipping further. The key level is noted around $4,250, which is acting as a strong support for the next test.
With the Ethereum bears, the price might bring in a retest at a crucial support level at around $4,407. In a highly bearish scenario, the altcoin could trigger the death cross emergence and send the price below the $4,400 mark. If ETH could reverse the momentum, it might rise and find the $4,419 resistance. An extended bullish pressure may push the golden cross to take place and drive the price above $4,425.
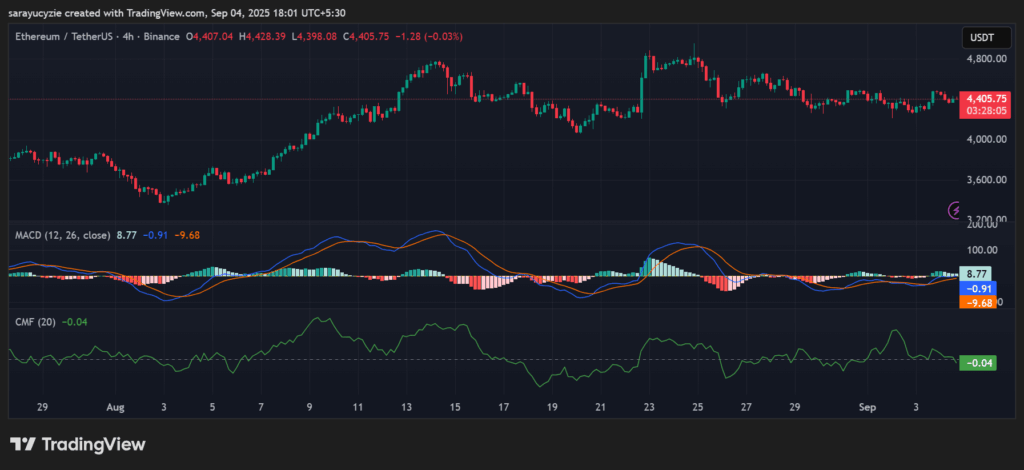
The Moving Average Convergence Divergence line and the signal line of ETH are settled below the zero line, indicating that the market is bearish. Since the MACD line is briefly below the zero line, the bearish momentum may weaken and gear up for a potential shift if it crosses above zero. Besides, the Chaikin Money Flow (CMF) indicator of Ethereum at -0.04 shows a slight negative money flow into the asset. Notably, the selling pressure is a bit stronger than the buying pressure in the market.
Moreover, the Bull Bear Power (BBP) reading of the altcoin found at 30.32 indicates a strong bullish dominance in the market. It signals that the buyers are pushing the price above, showing strong upward momentum. Ethereum’s daily Relative Strength Index (RSI) value at 51.16 is in a neutral to slightly bullish zone. The price action could also move either way, depending on the trend confirmation.
Highlighted Crypto News
Green Flash or Red Fade: Will Stellar (XLM) Bulls Light It Up or Will Bears Drag It Down?

