
Ethereum is showing early warning signs of short-term weakening as it grapples with critical resistance points. With market indecision and bearish indications recently observed, there may be possibilities for range-bound action or a retracement move.
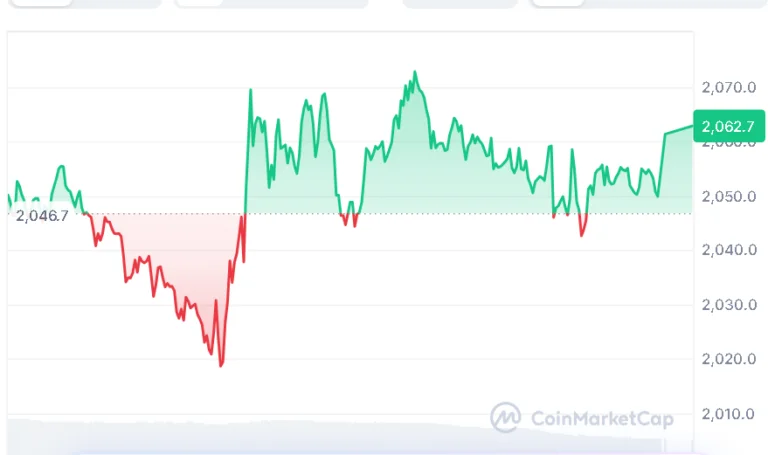
At the time of writing, Ethereum (ETH) is trading at $2,062.73, with a 24‑hour trading volume of $24.59 billion and a market capitalization of $248.73 billion. Over the last 24 hours, ETH has posted a modest 0.80% gain, as investors continue to weigh short‑term technical signals against broader market uncertainty.
Also Read | Drift Protocol Suffers From $286 Million Breach, Triggers Market Shock
On April 3, 2026, a well-known crypto analyst, CRYPTOWZRD, presented an in-depth technical analysis of Ethereum and warned that the current price structure indicates short-term weakness.
As per CRYPTOWZRD, there was a breakdown of the daily support at $2,120 for ETH, indicating a possibility of a decline in prices. According to him, a test of the $2,100 resistance level intraday-wise might offer an excellent chance to sell since rejection would be an indication of further consolidation.
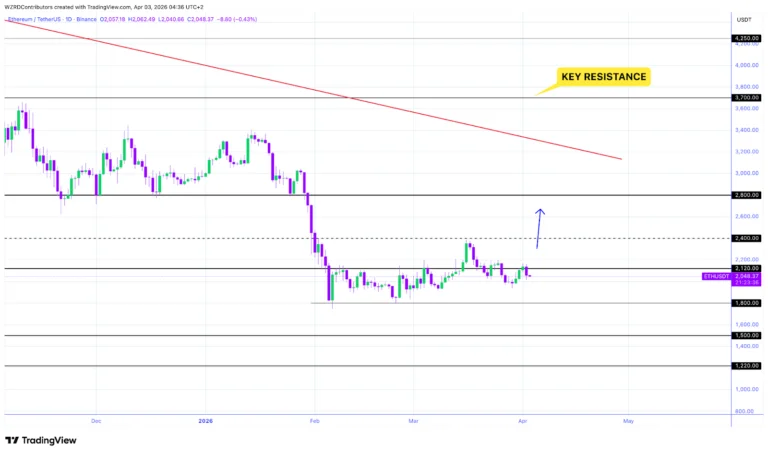
The ETH daily candle and ETH/BTC ended the session in bearish form, the analyst stated, noting that there was a need for an ETH/BTC breakout in the bullish direction from its present levels. This would make Ethereum’s price more attractive.
In this regard, the market sentiment is driven by political risks, and price action will be uncertain. In addition, CRYPTOWZRD stated that failing to hold above $2,120 has made Ethereum remain in “a weak position,” with the next level of support at $1,800. Nevertheless, the analyst indicated that Ethereum would move lower in the event that Bitcoin drops below critical levels.
On an intraday basis, there has been considerable volatility. ETH tested $2,100 resistance before falling back, indicating another shorting chance. Conversely, maintaining support above intraday resistance could extend consolidation.
Ethereum is trading near $2,060, with an RSI reading of 47.93, depicting poor and neutral momentum. The price is currently trading under the 20-day moving average line of $2,118, as well as near the 50-day moving average line of $2,046, pointing to some downside pressure. Resistance can be found further up at $2,431 and $3,018.
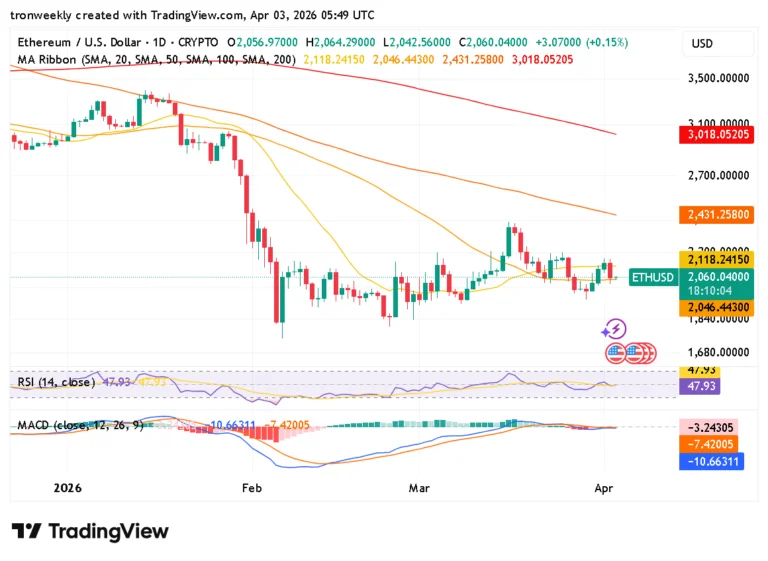
The MACD is currently negative, with the MACD line standing at -10.66 compared to the signal line, which is at -7.42. In addition, the histogram is currently in the red zone with values at -3.24, an indication that the sellers are controlling the market. Momentum is low in the market.
If no forceful buying occurs, then it is likely that Ethereum may continue to trade sideways or move towards the lower supports at $1,800. Investors should pay special attention to price levels like $2,100 and lower support at $1,800.
Given that market sentiment is still affected by geopolitical factors, ETH’s subsequent directional movement could depend on the general direction of the crypto market, with the most prominent example being Bitcoin.
Also Read | United States Government Takes Bold Stand Against Illinois Over Market Control

