
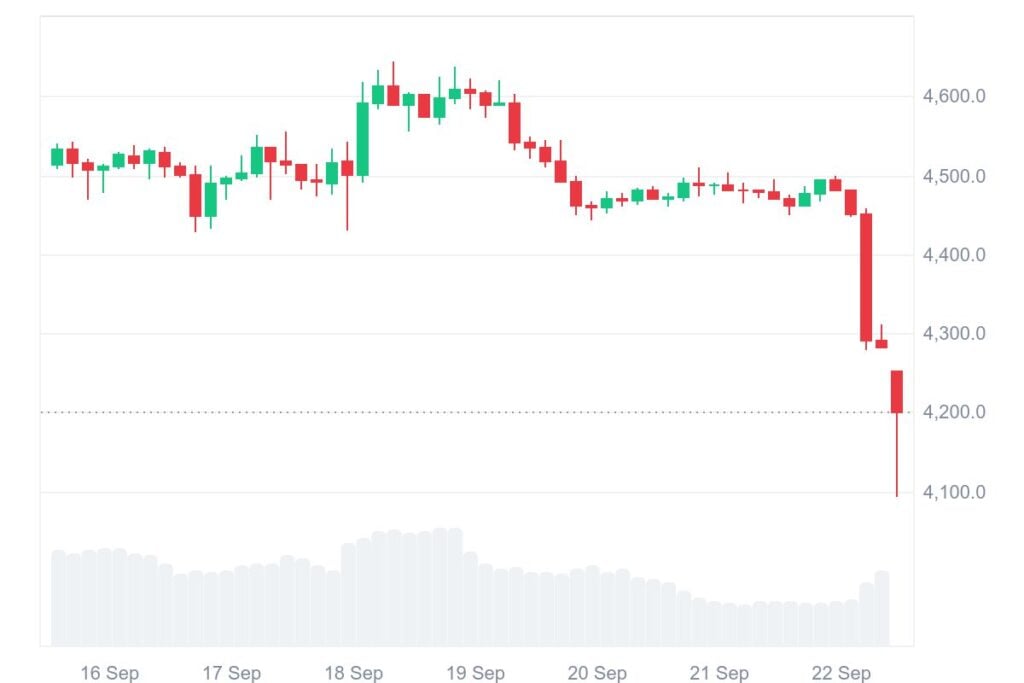
Ethereum is under sustained pressure as sellers dominate short-term sentiment. The asset fell 5.86% in the last 24 hours and 8.61% over the past week. At present, ETH is trading at $4,219.22, reflecting weakness across broader digital assets.
Daily trading volume surged to $41.56 billion, marking a sharp 125.09% increase, while its market capitalization stands at $509.49 billion. The rise in trading activity shows strong participation, though the overall trend remains tilted to the downside.
Despite selling pressure, analysts highlight a key breakout zone near $4,123.86. This level, once a barrier for rallies, has now flipped into support. Holding above this point is critical to sustain a bullish case in the medium term. The level also carries historical importance, acting as a turning point in 2024. Its retest and confirmation as support are seen as constructive signals, even in the face of recent declines.
Also Read: Ethereum (ETH) Price Eyes $4,200 Pullback Before a Potential Rally to $7,700
Ethereum’s breakout has set the stage for a possible upward continuation. Technical readings show that the breakout projection stock from the previous impulse leg began near $1,430 and extended to $4,123. The vertical distance of $2,693.62 adds to the breakout zone, projecting a target of $6,800. This represents a potential 65% move higher from the breakout level.

The current level of trading, just near support at $4,174.14, indicates buyers keeping the breakout trend in check. This can also be interpreted as consolidation, which often precedes new acceleration. Analysts argue that as long as the token stays above $4,123, it’s good for the bullish trend. Bullish and bearish players will keep a sharp focus on movement at this point, as this sets the tone of whether the perceived move to $6,800 materializes.
While there is support on the chart for bullish continuation, there are also momentum indicators to discourage this opinion. The Relative Strength Index (RSI) fell to 40.27, which dropped below neutral ground and shows eroding buying strength. Sellers continue to build strength, although RSI still hovers outside oversold territory. Another decline can have downside risk.

The Moving Average Convergence Divergence (MACD) also supports the bearish case. The MACD line at 25.43 has declined below the signal line at 59.02, reinforcing a bearish crossover. Growing red histogram bars confirm short-term weakness and intensifying bearish momentum.
The line and histogram both confirm short-term weakness. To reverse sentiment, ETH needs to contract the histogram and potential crossover to the positive side. Until this happens, buyers will continue to take a backseat regardless of the long-term bullish setup.
Also Read: Ethereum (ETH) Stalls: Market Awaits Critical Move


