
Ethereum (ETH) remains in a steady trading range even as the broader market reflects mixed signals. At the time of writing, ETH is trading at $4,197.74. The asset shows little change over the past 24 hours but is down 7.01% on the weekly chart.
Daily trading volume has fallen by 20.94% to $37.08 billion, while market capitalization holds at $506.16 billion. Despite the pressure, Ethereum continues to dominate as one of the most widely adopted digital assets in the sector.
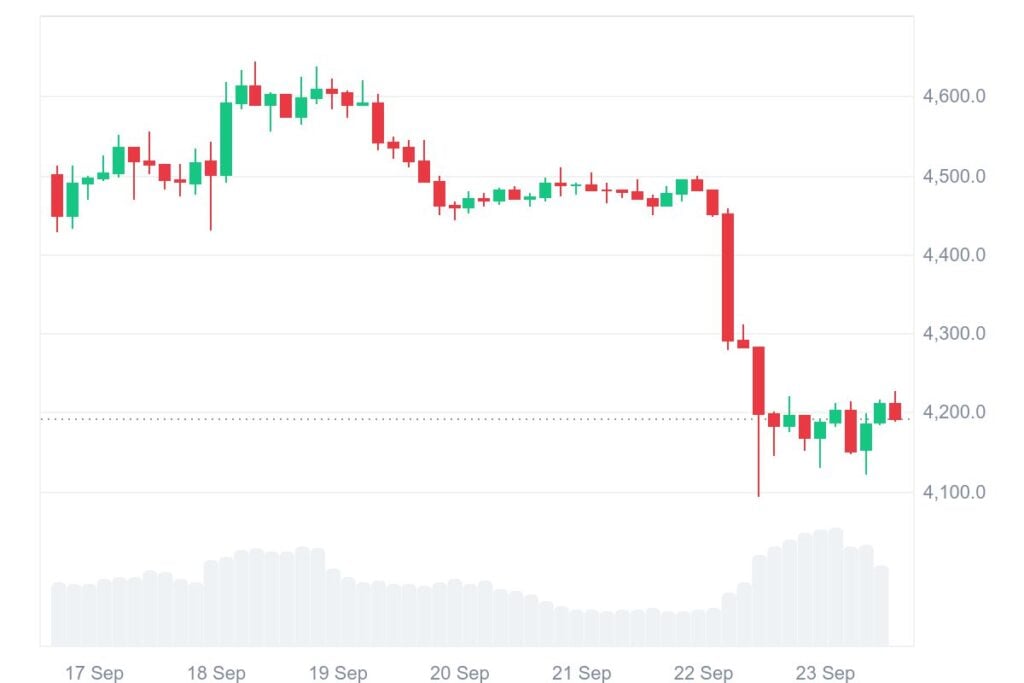
This relative stability contrasts with recent weakness as buyers and sellers battle for control near the $4,200 level. The sideways movement suggests the market is waiting for a trigger that could define the next trend, whether upward or downward.
Also Read: Ethereum Price Outlook: Holding $4,123 Support Could Drive Rally Toward $6,800
A massive purchase worth $1 billion has re-energized the Ethereum market. A new whale entered the market, acquiring a significant amount of ETH in a single transaction. Such large-scale accumulation demonstrates confidence in Ethereum’s long-term potential, particularly as institutional activity grows.
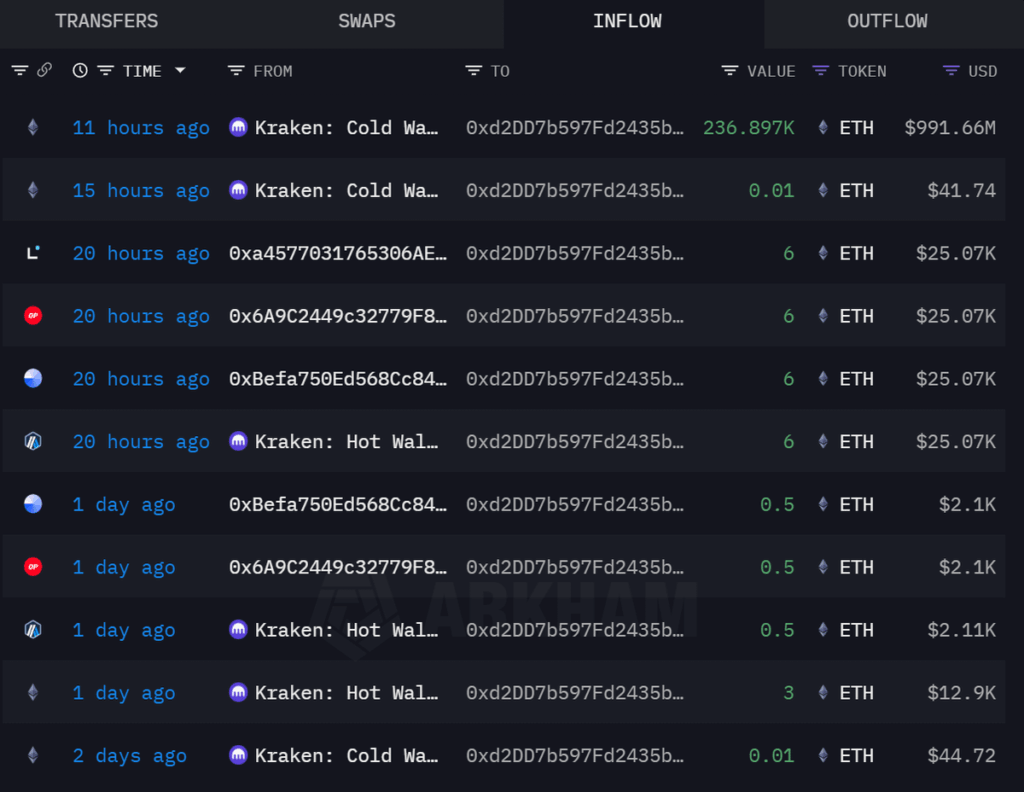
Historically, whale entries often trigger short-term volatility but ultimately reinforce the dominance of top assets. The current rotation trend shows capital moving away from smaller altcoins toward Ethereum and other high-liquidity tokens. This shift signals a potential bullish setup, as investors seek safer ground amid market uncertainty. With fresh momentum from whale activity, Ethereum could soon attempt another strong push upward.
Ethereum’s technical chart reflects a tug-of-war near the $4,150–$4,250 demand zone. According to market analysts, ETH must reclaim $4,250 to ignite fresh bullish momentum. A failure here risks deeper corrections. Resistance is set at $4,580–$4,600, with higher targets at $4,687 and $4,714. On the downside, buyers are expected to defend $4,000–$4,100, with additional strong zones near $3,850 and $3,700.

The current consolidation suggests two possible outcomes. If ETH maintains a level higher than $4,200 and regains $4,300, it may move up towards $4,580. A breakout would further solidify the argument for a short-term turnaround. Otherwise, a drop below the $4,150 level may send ETH into lower liquidity areas, potentially taking the price all the way down to $3,700.
The Relative Strength Index (RSI) of Ethereum also sits at 29.79, which signals the current oversold condition beneath the neutrality line of the 30 mark. This represents a notable drop from the earlier RSI value of 40.32, which shows increasing selling pressure. Holding below 30 could see Ethereum continue sliding, but a move back up through this level would suggest relief bounce potential.

The Moving Average Convergence Divergence (MACD) also reveals a bearish picture. The MACD line is at -79.74, while the signal line is at -37.70. The histogram also continues to widen in red below the zero line, which shows rising negative momentum. The wide gap between the MACD and the signal line also supports the fact that bearish pressure continues gaining traction, with minimal signs of bullish crossover.
Also Read: Bitcoin, Ethereum Drive $1.9 Billion Inflows as Fed Rate Cut Lifts Crypto Market


