$Ethereum has officially broken below the $3,200 support zone, a level that has held multiple times over the past weeks. This breakdown comes immediately after Bitcoin’s violent crash under $100,000, which triggered market-wide panic selling.
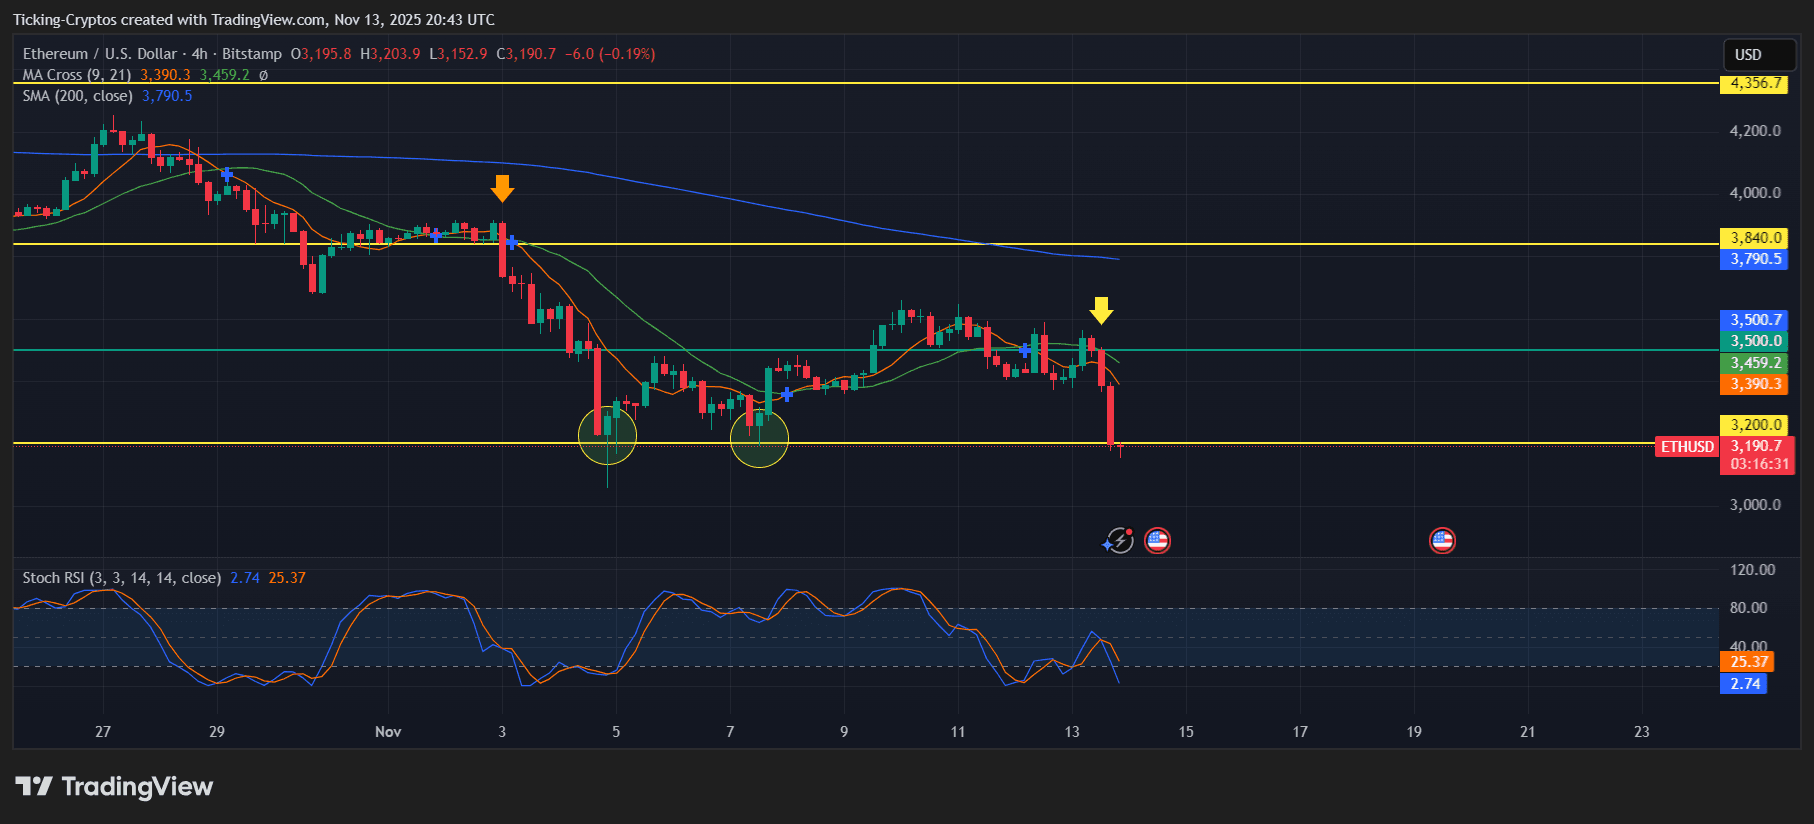
ETH/USD 4-hours chart - TradingView
$ETH reacted instantly, falling more than 5% in a single 4H candle as buyers failed to defend the yellow support line on your chart.
The chart above shows:
Now that $BTC broke below 100K, the historical correlation strongly suggests ETH will not hold the $3,200 floor this time.
If ETH loses the $3,200–$3,150 band:
🔻 $3,000 – psychological level: Likely to be tested quickly if BTC continues sliding.
🔻 $2,850 – $2,800 – major demand zone: This is the next real support on the macro chart. ETH should reach this area next if Bitcoin remains under pressure.
🔻 In an extreme flush: $2,650: Upside recovery only starts if ETH reclaims:
🔼 $3,350 – $3,480: Critical resistance cluster. Failure here = continuation down.

