
Ethereum seems to be rebounding from its breakout past the range of $2,150-$2,200 resistance level, gaining back the attention of investors. Even though there have been improvements in the short-term trends, it is important to note that the move does not represent any kind of uptrend in the long run.
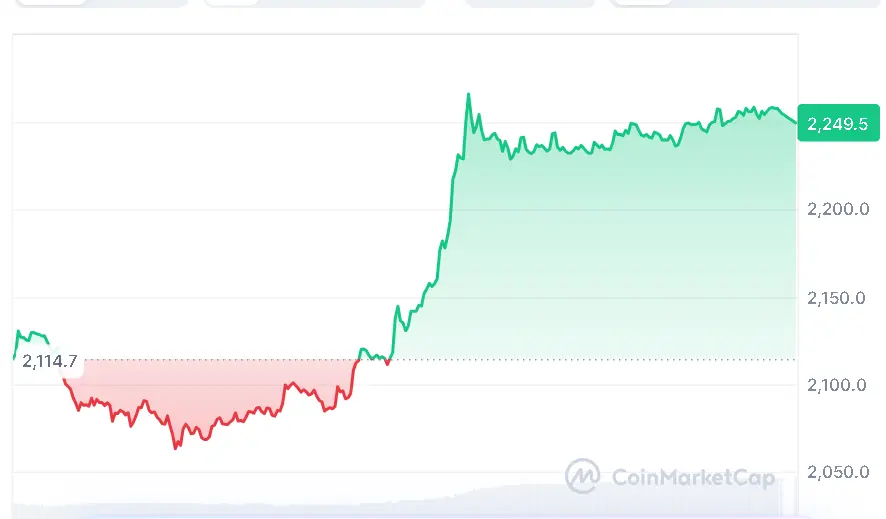
At the time of writing, Ethereum (ETH) is trading at $2,249.50, recording a 24-hour trading volume of $47.18 billion and a market capitalization of $271.98 billion, according to CoinMarketCap. The ETH has gained over 6% over the last 24 hours, reflecting growing market activity and renewed investor attention.
Also Read | Injective (INJ) Consolidation Phase Hints at Potential Breakout Toward $17
A prominent crypto analyst, Ted, noted on April 8, 2026, that ETH has been able to break past the $2,150-$2,200 resistance range, which is an indication of short-term bull market tendencies. So long as the price remains above the $2,200 threshold, ETH has the possibility of touching its previous monthly high once more.
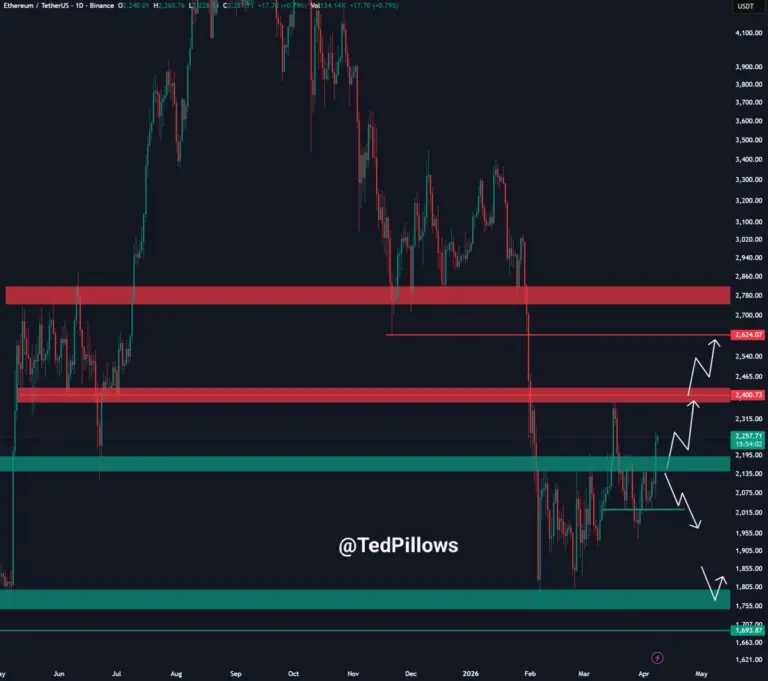
Nevertheless, caution was advised by Ted as well. Though there has been an upward push recently, this does not mean that it marks the start of a lengthy upward trend. As per the forecast provided, it is possible that in Q2 or Q3 of 2026, there might be further declines for Ethereum.
From a technical point of view, Ethereum seems to be performing well. Currently, the RSI indicator is at 61.55 and is above the 50 neutral level, implying that buyers are accumulating their positions. Price remains above short-term moving averages around $2,096 and $2,060.

The Ether price is trading under the key resistance zones marked by the 100-day moving average around $2,392 and the 200-day moving average at around $2,958, indicating overall uncertainty in the market.
The momentum indicators, such as the MACD, are now showing a slight bullish bias as the MACD line has crossed above the signal line.
Overall, Ethereum’s breakout has improved short-term sentiment, but the broader market outlook remains cautious.
Also Read | Aster (ASTER) Accumulation Phase Points to a Strong Breakout Toward $20

