Ethereum surges nearly 23% this quarter now as crypto traders debate if the rally is real or a bounce back from steep 2026 losses.
Ethereum has climbed nearly 23% this quarter, a pace more than double its typical Q3 average of 9%.
The move follows a rough start to 2026, when ETH dropped 29% in Q1 and another 25% in Q2. Traders now debate whether this marks genuine strength or a simple bounce after steep losses.
Analyst Master of Crypto raised the question directly on X, pointing to weak institutional flows into ETH. On the daily chart, meanwhile, the token testing a critical resistance zone near $1,920.
Master of Crypto’s post on X described ETH’s climb as impressive but flagged it as potentially misleading. The account noted that ETH fell sharply through the first half of the year before this rebound.
$ETH is up nearly 23% this quarter.
That's more than double its normal Q3 gain of around 9%.
At first, this looks very bullish.
But remember, ETH had a terrible start to the year. It fell 29% in Q1 and another 25% in Q2.
So this strong move could simply be ETH recovering… pic.twitter.com/HwOAdcxph2
— Master of Crypto (@MasterCryptoHq) July 22, 2026
Q1 losses reached 29%, followed by a 25% drop in Q2. Viewed against that backdrop, the current gain looks smaller than the headline number suggests.
The analyst also addressed a popular narrative that money is rotating from Bitcoin into Ethereum. Data cited in the post shows large investors still favor BTC over ETH.
Until that pattern shifts, the account argued, the rally resembles a recovery rather than a fresh long-term trend.
Read also:
BlackRock Fuels Bitcoin ETF Inflows as Ethereum Funds Bleed
Trader Ted highlighted a different angle in a separate post on X.
He pointed to the $1,870 to $1,900 range as a support zone worth watching. Holding that level, according to Ted, could open the door to a move above $2,000.
A daily chart review on TradingView showed ETH trading around $1,917 at the time of writing. That price reflects a recovery of more than 20% from June’s low near $1,550. Buyers have defended the $1,750 to $1,800 zone in recent weeks, turning it into short-term support.
Resistance now sits in the $1,920 to $1,950 range, an area where sellers have stepped in before.
Trading volume improved during the climb off June’s lows but has eased slightly near resistance. A breakout would likely need stronger buying pressure to hold, based on the chart data.
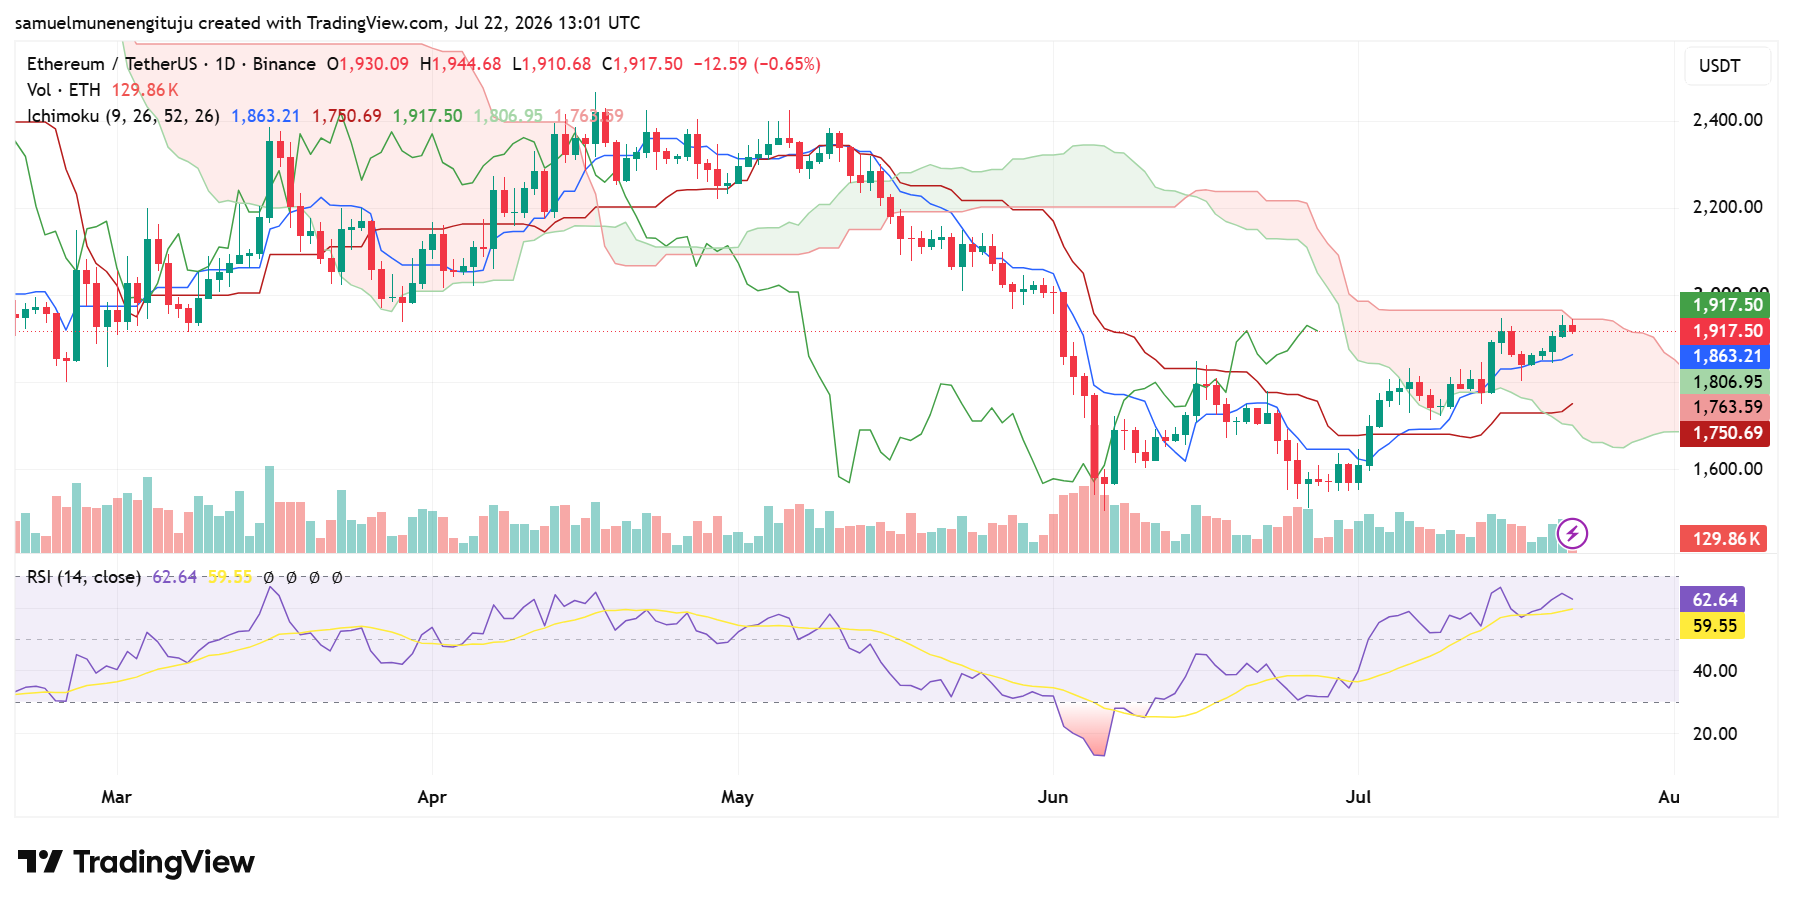
Ethereum trades above both the Tenkan-sen at $1,863 and the Kijun-sen at $1,764, per the TradingView breakdown. That positioning points to short-term bullish momentum.
Still, price sits inside the Ichimoku cloud, a sign the broader trend remains neutral despite recent gains.
The cloud’s upper edge sits near $1,920, marking a key breakout zone for ETH. A daily close above that level would strengthen the bullish case. It could also open a path toward resistance near $2,050 to $2,100.
The 14-day RSI reads 62.6, staying above its signal line of 59.6. That reading sits below overbought territory, which starts above 70. Momentum remains positive, though the RSI is beginning to flatten as price nears resistance.
A failed break above resistance could send ETH back toward $1,860 or $1,760.
Stronger support sits in the $1,760 to $1,800 zone, where the Kijun-sen and past swing lows converge. These levels could signal which direction the rally takes next.
The post Ethereum Surges 23% This Quarter, but Is the Rally Built to Last? appeared first on Live Bitcoin News.





