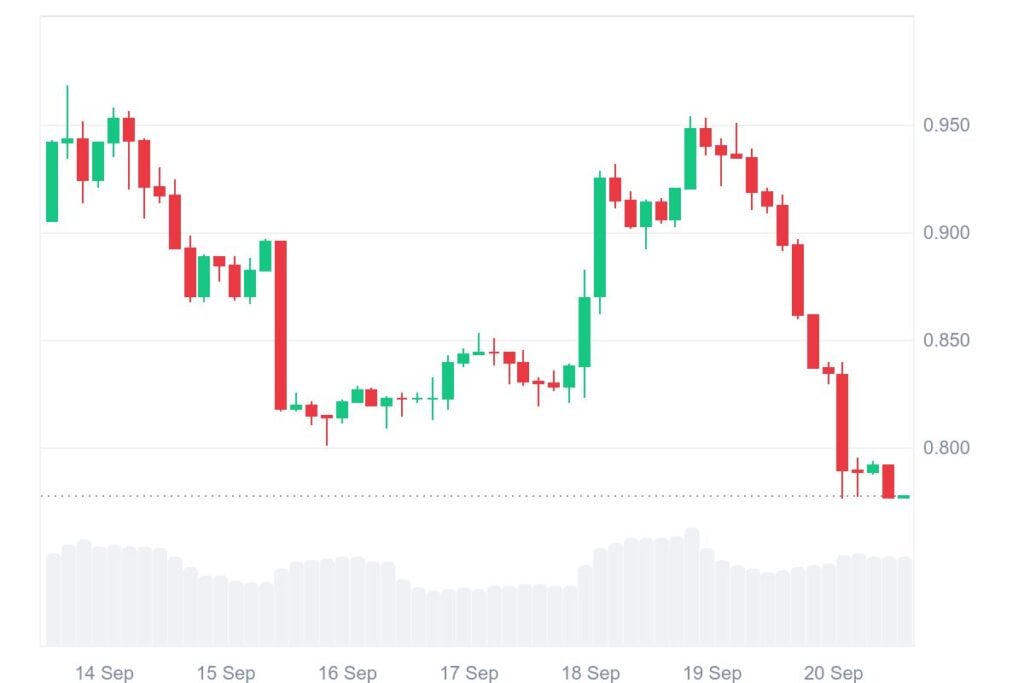
Fartcoin is experiencing notable downward pressure, with its price falling by nearly 14.4% over the past 24 hours. The asset is now trading at $0.7811, closely mirroring the broader weakness in the crypto market. Weekly performance also shows a decline of 13.65%, further underscoring ongoing weakness.
Despite the price drop, trading volume has risen by 18.56% to $174.28 million, suggesting increased market activity. Meanwhile, market capitalization stands at $780.81 million, reflecting a 14.46% decrease during the same period.
Also Read: FARTCOIN’s Elliott Wave Pattern Signals Potential 150% Price Surge
Analysts point to the 0.618 Fibonacci retracement level at $0.7707 as a critical support zone. A hold above this level may set the stage for a short-term rebound. If bears push the price lower, the next major support lies near $0.5191. On the upside, resistance levels are set at $0.9474, $1.1241, and $1.3427. The upcoming path depends on buyers defending the current support area.

The price remains below the 25, 55, 100, and 200 EMAs, which are clustered between $0.86 and $0.98. This cluster of moving averages is a prevailing resistance base and has capped recovery attempts many times. Unless the bulls reassert themselves in this zone, the momentum is going to stay constrained.
The 4-hour chart shows more weakness in the momentum indicators. The Relative Strength Index (RSI) is at 31.72, near the oversold level of 30. The level is an indicator of strong selling pressure, although it is also an indication that there might be a reversal if the conditions change.

Meanwhile, the bearish trend is confirmed by the MACD with a recent crossing. The current value of the MACD line is below the signal line, as it is seen at -0.01796 against -0.01526. The histogram shows a negative reading of -0.00270. These are signs of increasing downside momentum and confirm the bearish signal seen in the RSI. They generally call for caution on long positions in the near future.
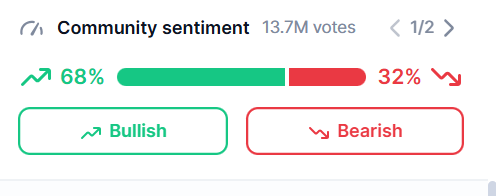
Despite the bearish chart perspective, trader sentiment is resilient. A survey of 13.7 million users reveals that while 68% are still bullish on Fartcoin, 32% are bearish. This one-line disagreement between chart signals and sentiment implies that traders are still believing there is a bounce, even as chart signals caution otherwise.
Also Read: Fartcoin Price Analysis: Bullish Inverse Head Shoulders Targets $1.20


