Fetch.ai (FET) is currently testing the lower boundary of its long-term descending channel on the 3-day chart. According to the crypto analyst Jonathan Carter, this technical level often acts as a strong support zone, and recent trading activity shows early signs of accumulation.
Jonathan Carter suggests that this retest could present a buying opportunity, as the token’s structure remains intact despite recent downward pressure.
Trading volumes indicate that buyers are stepping in, signaling renewed interest in the token at these lower levels. The combination of accumulation and support retest suggests potential momentum for an upward move.
Traders are watching closely for confirmation, as maintaining the channel’s integrity is crucial for a sustained rally and to prevent further downside risk.
Also Read: Fetch.ai Eyes $0.194 After Forming Potential Five-Wave Structure
If this bounce holds, FET could be aiming for a number of key resistance points, starting with $0.27 and $0.35. The medium-term potential could have the token reaching $0.54 and $0.80, and the long-term potential has FET reaching $1.10 and even $2.00.
These figures relate to price ceilings, which have been seen in the asset’s history and could experience some profit-taking.

Source: Jonathan Carter’s X Post
However, caution is advised as the level of invalidation at $0.115 is a critical level, and if the price drops below this level, it may indicate the breakdown of the bullish structure.
It is also important to observe the price action as it holds the support zone to see if FET can continue to move in the right direction. The coming days are crucial for the potentially promising price rebound.
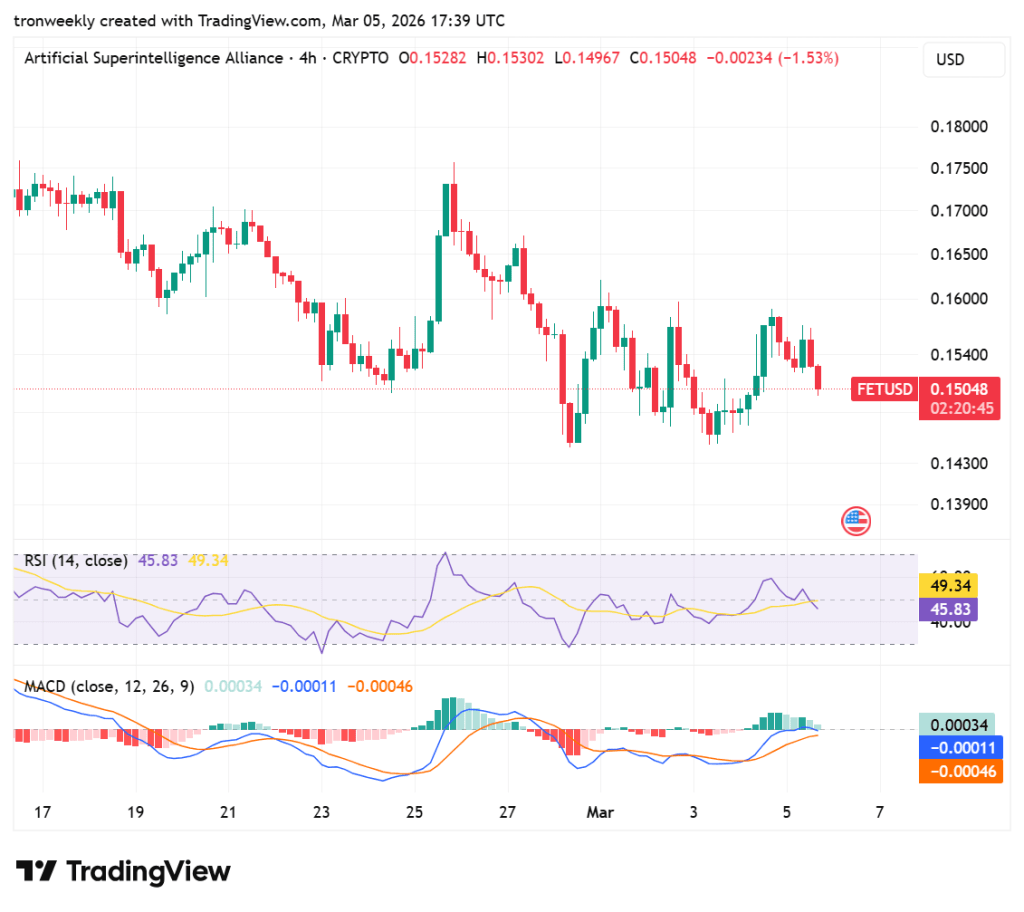
According to TradingView, the RSI value is at 45.83 and has taken a neutral position, slightly lower than its signal line at 49.34. This position suggests that there is no major buying pressure in the market, given that it has settled in the lower half of the range.
The changes in RSI value indicate that the market is undergoing consolidation with a slight bearish bias since it has stayed lower than the midpoint.
Source: TradingView
The MACD is showing a cooling trend, with the blue line at -0.00011, almost touching the orange signal line.
Although the MACD is technically in a weak bullish crossover, the bars on the histogram are shrinking, indicating that the upward momentum is running out. The proximity of the MACD bars to the zero line indicates that the asset is currently searching for a breakout.
Also Read: Fetch.ai (FET) Descending Resistance Break Could Send Price to $0.24 Zone