Few things frustrate traders more than a false breakout. You sell the breakdown, only to watch the price recover yet again. You buy the recovery, only for momentum to disappear. After months of Bitcoin remaining stuck in a sideways range, the challenge is no longer spotting the breakout. It’s knowing whether it has the strength to last.
That’s where the Rate of Change (ROC) indicator comes in. Rather than predicting where price will go next, ROC measures whether price momentum is accelerating or fading, helping traders distinguish between genuine breakouts and false starts.
In this episode of Chart Decoder Series, we explore how traders use the Rate of Change (ROC) on Bitfinex to spot early shifts in trend strength and confirm breakouts using Bitcoin’s latest price action as a real-world example.
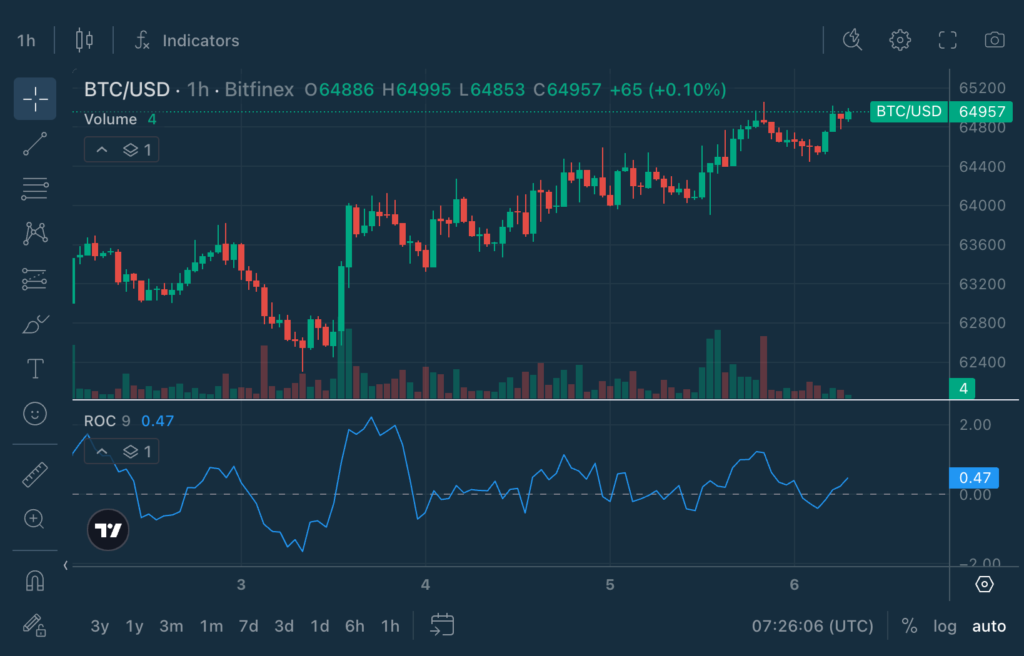
Rate of Change (ROC) is one of the oldest and most straightforward momentum indicators in technical analysis. Rather than tracking price directly, it measures the percentage change in price between the current candle and the price a set number of periods ago.
The formula is simple:
ROC = ((Current Price − Price n candles ago) / Price n candles ago) × 100
Bitfinex uses a default of 9 candles, so ROC compares the current price to the price 9 candles ago. In short, ROC tells you how much price has moved, in percent, since that earlier candle. In the above example, the ROC reads +0.47, meaning the current price is 0.47% higher than it was 9 hours ago (using Bitfinex’s default setting).
The result is plotted as a single line that oscillates around a zero line:
Because ROC has no fixed upper or lower boundary, it captures the raw speed of a move. The further ROC travels from zero, the stronger the momentum in that direction. This is what makes it such a clean tool for spotting when a trend is accelerating, or quietly losing power.
You can set any lookback setting on Bitfinex. Most traders use a lookback period of 9, 12 or 14 candles. Shorter settings react faster and pick up more noise. Longer settings are smoother but slower to respond to price changes.
It all comes back to the zero line.
Keep in mind: ROC measures speed, not the direction of the larger trend. A high ROC reading tells you a move is fast, not that it will continue. Always combine ROC with price structure, support and resistance, or indicators like RSI and MACD for confirmation.
At first glance, Rate of Change (ROC), Relative Strength Index (RSI), and Chaikin Money Flow (CMF) can all seem to play with a center line and measure momentum. In reality, each looks at the market from a different angle.
Rate of Change (ROC) is an unbounded indicator that fluctuates around a zero line.
Relative Strength Index (RSI) is bounded between 0 and 100 and is centred around 50, with the commonly watched overbought and oversold levels at 70 and 30.
Chaikin Money Flow (CMF) is unbounded and oscillates around a zero line.
Although ROC and CMF both use a zero line, they measure different aspects of market behaviour.
A quick price move can shoot ROC up while CMF stays flat or even dips. That tends to happen when liquidity’s thin and a few trades push price around, or during a short squeeze, where traders closing shorts drive the price higher without much fresh buying coming in.
When ROC and CMF rise together, that’s different. Price is speeding up and there’s real buying behind it. A lot of traders treat that as a stronger sign the move means something,

Let’s look at the BTC/USD 1-hour chart on August 6th, 2026.
After repeatedly defending the $63,000 area over the past month, Bitcoin has climbed back towards $65,000, printing a series of higher highs and higher lows. As Bitcoin climbed from the $63,000 area towards $65,000, the ROC repeatedly recovered above the zero line after brief pullbacks, suggesting bullish momentum continued to re-emerge as the uptrend developed.
As Bitcoin approached resistance near $65,000, however, the ROC began to pull back even while price continued trading near its highs. This suggests that although buyers remained in control, the pace of the advance had started to slow. A weakening ROC does not necessarily signal a reversal, but it can be an early indication that bullish momentum is cooling.
More recently, after a brief period of sideways consolidation, the ROC has turned back above zero as Bitcoin once again tests the $65,000 level. This suggests positive momentum has returned, although traders will want to see the indicator continue rising if the breakout is to gain traction.
The next signal is straightforward:
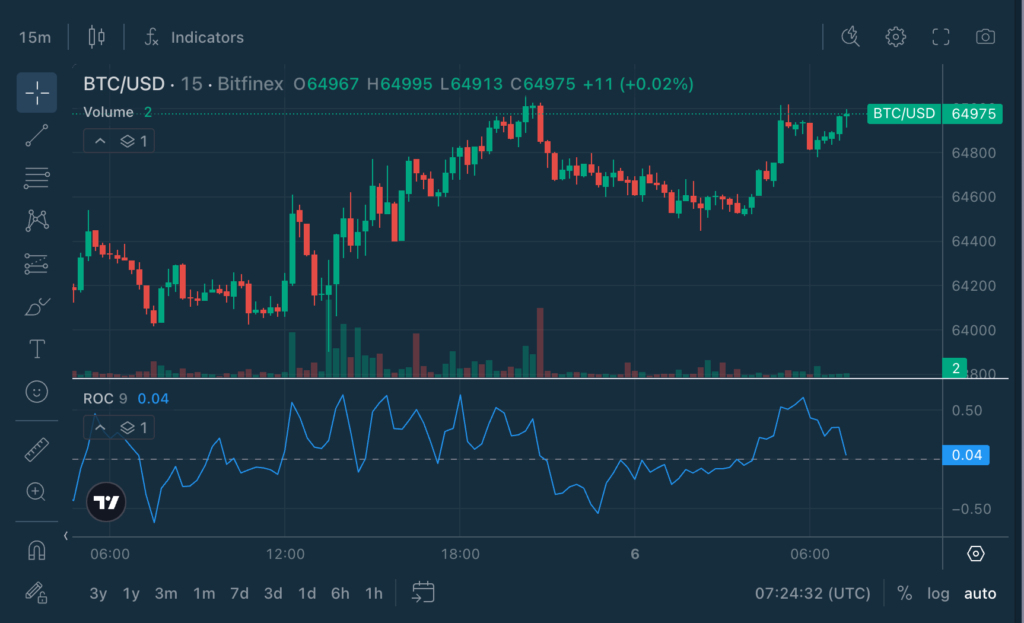
Let’s look at the BTC/USD 15-minute chart on 6 August 2026.
Bitcoin has climbed back towards $65,000, retesting its recent highs after a steady recovery. At first glance, the rally appears healthy, with the price continuing to edge higher.
The Rate of Change (ROC), however, tells a more nuanced story.
Although Bitcoin has returned to nearly the same price level, the ROC has made a noticeably lower high than during the previous rally. This means that while buyers are still pushing prices higher, they’re doing so with less momentum than before. In other words, the rally is continuing, but its pace has begun to slow.
This is known as a bearish divergence, where price makes a similar or higher high while momentum weakens. A bearish divergence doesn’t guarantee a reversal, but it can serve as an early warning that buying pressure is fading and the current move may be losing strength.
The next signal is straightforward:
Shorter timeframes often reveal these subtle shifts in momentum before they become visible on higher timeframe charts, making the ROC a useful tool for traders looking to anticipate changes in market strength before they appear in price alone.
Watch the zero line first
Watch for divergence
Divergence is ROC’s most powerful signal.
Match the lookback to your timeframe
Pair it with structure
A momentum signal means more when it lines up with something real.
ROC + Moving Averages
Moving averages define the bigger trend; ROC times the momentum.
ROC + RSI
RSI tells you how stretched the move is; ROC tells you how fast it’s moving.
ROC + MACD
MACD confirms momentum shifts.
ROC + Support and Resistance
This helps traders avoid treating every momentum shift as equal.
ROC + CMF
ROC shows whether price momentum is accelerating, while CMF reveals whether buying or selling pressure is supporting that move. When both rise together, momentum is backed by genuine market participation rather than thin liquidity or short covering.
Bitfinex. Master Your Universe.

Explore the full Chart Decoder library:
The post Chart Decoder Series: Rate of Change: How Traders Measure Momentum Behind A Move appeared first on Bitfinex blog.





