Fibonacci isn’t just math in trading. Instead, it’s one of the most widely used tools to spot potential turning points in price.
Beginners often struggle with when to enter or exit a trade, and this is where Fibonacci retracement and extensions can help.
In this post, we’ll break down practical strategies you can start using right away, whether you’re a day trader, swing trader, or someone looking to catch breakouts and reversals.
Jude Umeano, one of Nigeria’s most respected and successful traders just launched Afibie, a mentorship platform built to help you earn your first $10,000 and beyond from the markets.
Whether you’re new or stuck at break-even, this is your next step.👉 Visit Afibie now.
First, a quick history. Leonardo Fibonacci was a 13th-century mathematician who identified a sequence of numbers where each number is the sum of the two preceding ones: 0, 1, 1, 2, 3, 5, 8, 13, 21, and so on.
This sequence has fascinating properties, and the key for traders is the ratio between the numbers.
As the sequence progresses, the ratio of a number to its next higher number approaches approximately 0.618, or 61.8%. The inverse of this is 1.618, or 161.8%.
These are known as the “Golden Ratios,” and they appear everywhere in nature, art, and architecture.
In trading, they are believed to represent natural harmony and, more practically, levels where traders collectively tend to act.
Traders use these ratios to create a tool called Fibonacci Retracement.
Imagine a stock surges from $100 to $150. After such a strong move, it’s natural for the price to pull back a bit before potentially continuing higher.
This is where Fibonacci retracement levels (23.6%, 38.2%, 50%, 61.8%, and 78.6%) come in.
They highlight potential support areas during the pullback. The 50% level isn’t a true Fibonacci ratio, but traders watch it closely as a psychological halfway point.
Once the pullback is over and the original trend resumes, traders then look to Fibonacci extension levels (127.2%, 161.8%, 261.8%) as potential profit targets, showing how far the new move might stretch.
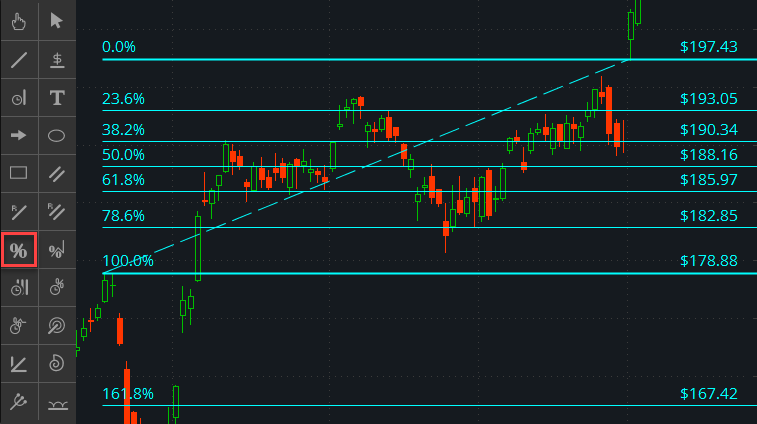
The best part is that plotting these levels is simple. On your trading platform, just select the Fibonacci tool.
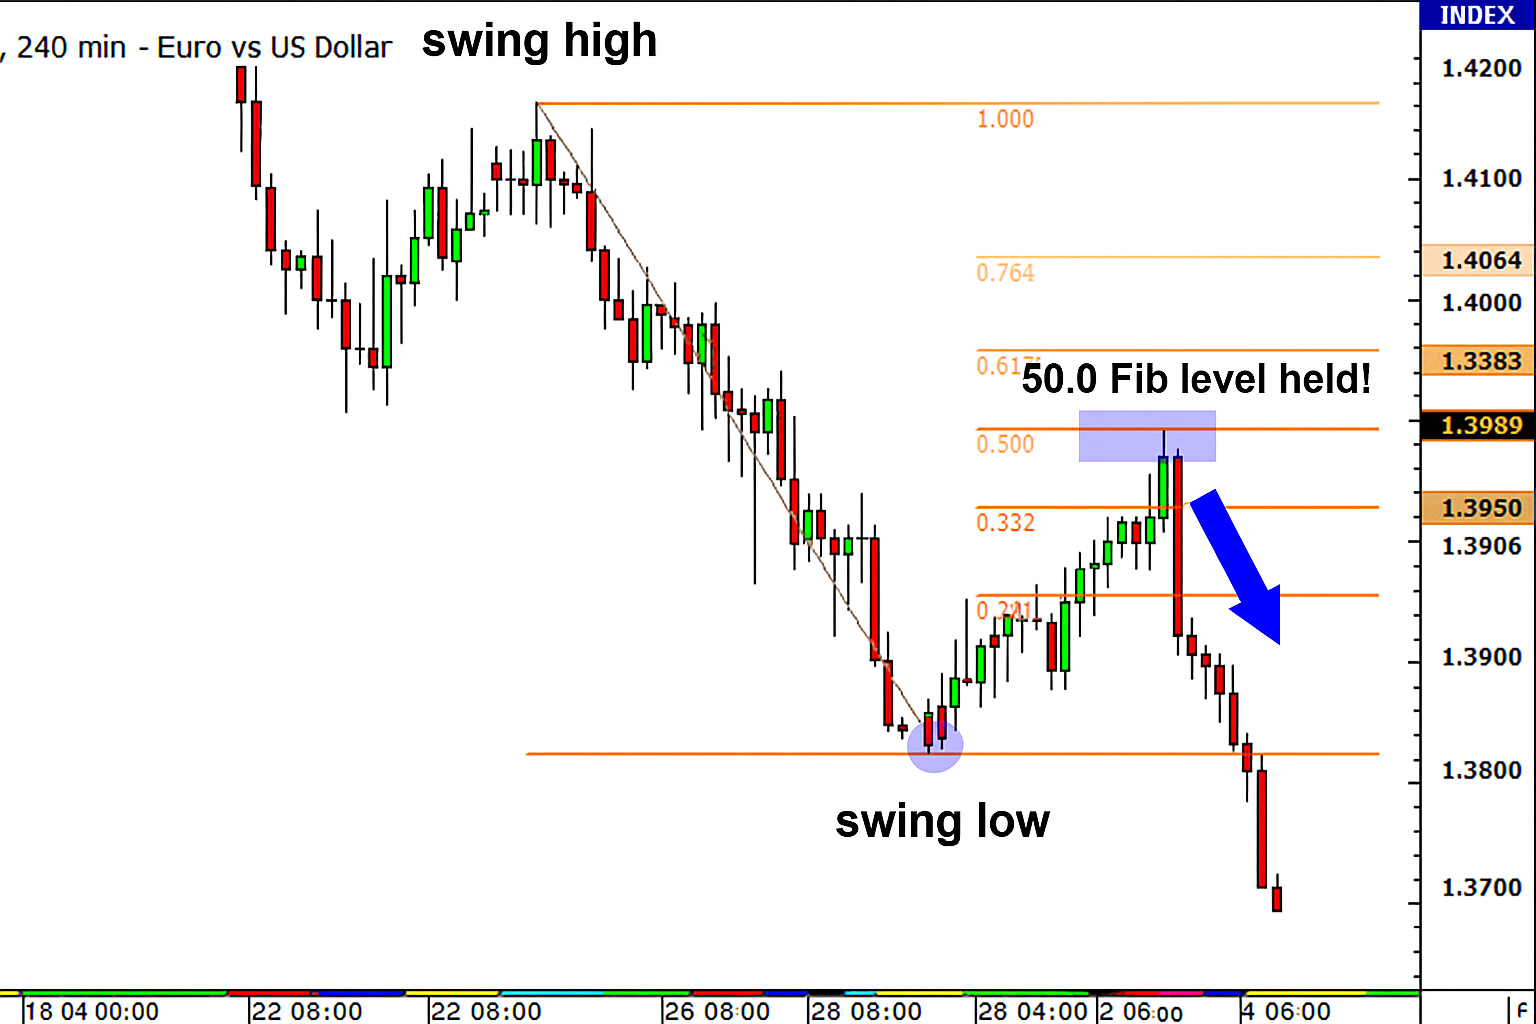
In an uptrend, click the swing low and drag it to the swing high; in a downtrend, click the swing high and drag it to the swing low.
The tool automatically marks out both retracement and extension levels for you.
Now that you understand the basics, let’s move into how day traders can apply Fibonacci for quick setups across different trading styles.
Day traders rely on quick entries and exits, and Fibonacci helps identify where price might bounce intraday.
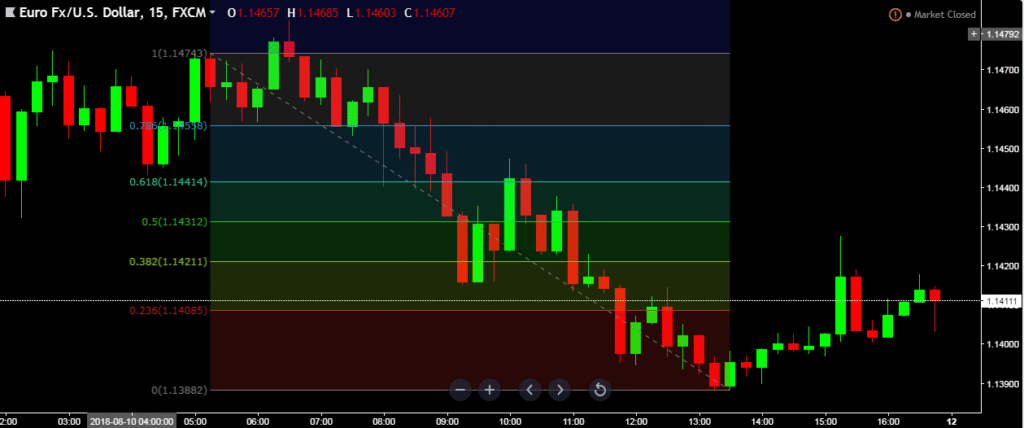
After a strong move up or down on the 15m or 1h chart, you plot Fibonacci retracement from swing high to swing low.
Price often retraces to the 38.2% or 61.8% level before continuing.
Once you see confirmation through a candlestick pattern (like a hammer or engulfing) or RSI showing oversold/overbought, you enter in the direction of the trend.
Stops are placed just beyond the next Fibonacci level, and profit is taken at the 23.6% retracement or previous swing high/low.
A more aggressive approach is combining Fibonacci retracement with moving averages.
For example, if price retraces to the 50% level while also touching the 200 EMA, that’s a high-probability entry.
Quick exits with a 1:1 or 1:2 risk–reward ratio keep trades tight.
Also Read: Fibonacci Levels vs Trendlines and Other Trading Tools
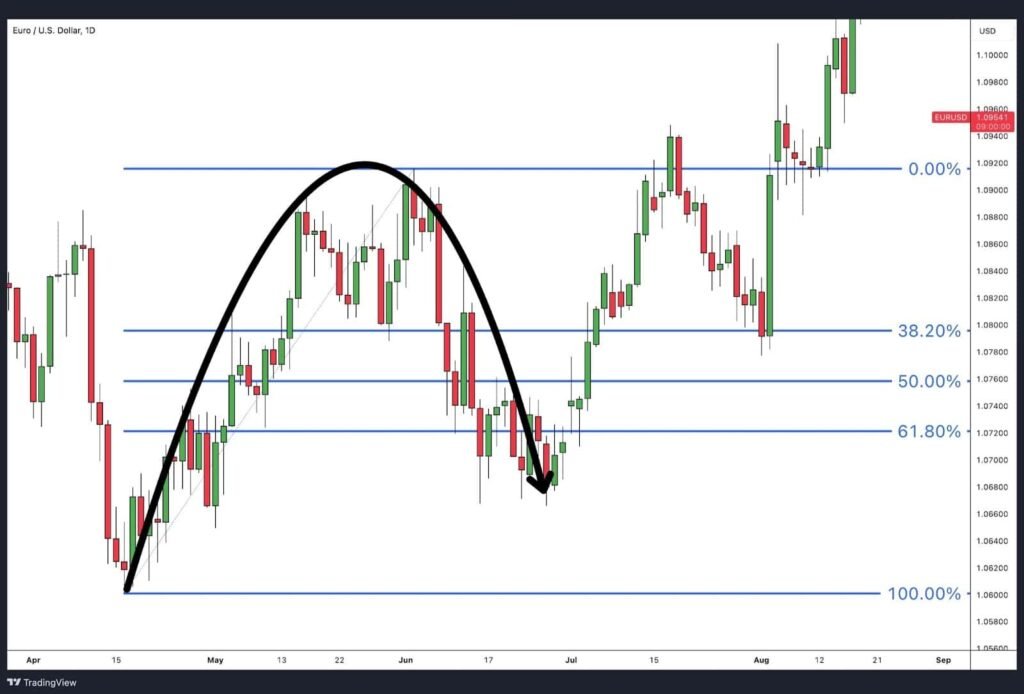
Swing traders hold trades for longer, making Fibonacci a great tool on the 4h or daily chart.
In a clear forex trend, say EUR/USD in an uptrend, you wait for price to retrace to the 50% or 61.8% level after a strong impulse move.
Entering long around these zones with a stop below 78.6% gives room for natural volatility, while targeting the previous swing high or a Fibonacci extension (161.8%) provides solid risk–reward.
In range-bound pairs, you can draw Fibonacci across the latest swing.
If price retraces deeply (61.8–78.6%) and rejects with strong candles, you trade back toward the opposite side of the range.
This setup works especially well when combined with support and resistance.
But what if you don’t just want to catch pullbacks, what if you’re trying to trade explosive breakouts or fading major reversals? That’s where Fibonacci becomes even more powerful.
Breakouts and reversals are some of the trickiest moves in trading, and Fibonacci can add structure to them.
When price consolidates after a strong move, draw Fibonacci on that prior swing.
If price pulls back to 38.2% or 61.8% and then breaks above the swing high (0% level), you’ve got breakout confirmation.
Fibonacci extensions (127.2% and 161.8%) become your profit targets.
Trading reversals is riskier and should only be attempted with caution and clear confirmation.
Look for a trend that has been running for a long time and is perhaps showing signs of slowing momentum.
Instead of waiting for a deep pullback, watch how the price behaves after a small retracement.
If the price tries to push to a new high but fails to even reach the 23.6% retracement level of the last decline, it signals weakness.
Look for bearish divergence on the RSI or MACD (the price makes a higher high, but the indicator makes a lower high). Also, watch for a strong bearish reversal candlestick pattern.
If all signals align, you might enter a short trade. A conservative take-profit target would be the 50% or 61.8% retracement level of the prior upward move.
Whether you’re trading quick bounces, longer swings, or major reversals, Fibonacci is flexible, but beginners should still approach it with caution.
Mastering Fibonacci isn’t about the lines themselves, but how you combine them with other tools to trade smarter. Here are some essential tips to guide you.
Never rely on a Fibonacci level alone.
Its power is multiplied when it aligns with other technical factors, such as a previous support/resistance zone, a key moving average, or a trendline.
Fibonacci levels indicate probable reaction zones, not certainties. Always use a stop loss.
Start by applying these strategies on a demo account.
Draw the tools on different charts and timeframes to get a feel for how price respects these levels.
While there are many levels, pay the most attention to 38.2%, 50%, and 61.8%.
These are the ones the market watches most closely.
Fibonacci is powerful because it works across markets and timeframes.
For day traders, it helps time quick entries. For swing traders, it offers pullback opportunities in trending markets.
And for those who love catching breakouts and reversals, Fibonacci provides reliable levels to watch.
With practice, you’ll start seeing these levels not just as numbers, but as psychological zones where traders react.
Have you tried trading with Fibonacci before, or are you just getting started?
Drop your thoughts in the comments, and if you found this guide helpful, don’t forget to share it with a fellow trader who could use it.
The post Fibonacci Trading Strategies for Beginners: appeared first on NIGERIA BITCOIN COMMUNITY.


