First introduced by market analyst John Bollinger in the early 1980s, Bollinger Bands are now a staple of technical analysis across financial markets. In crypto, traders use them to bring structure to fast-moving price action and to interpret volatility and momentum in real time. This guide shows how to read and apply them within practical crypto trading strategies.
Bollinger Bands are a widely used technical indicator that helps crypto traders see how far a price has moved away from its average. They consist of three components: a middle band, which is typically a simple moving average of the coin’s closing price over a chosen lookback period, and an upper band and lower band plotted above and below that average. The distance of the outer bands from the middle band is based on the standard deviation of price, multiplied by a user-defined factor.
Fun fact! Bollinger Bands even have their own official website.
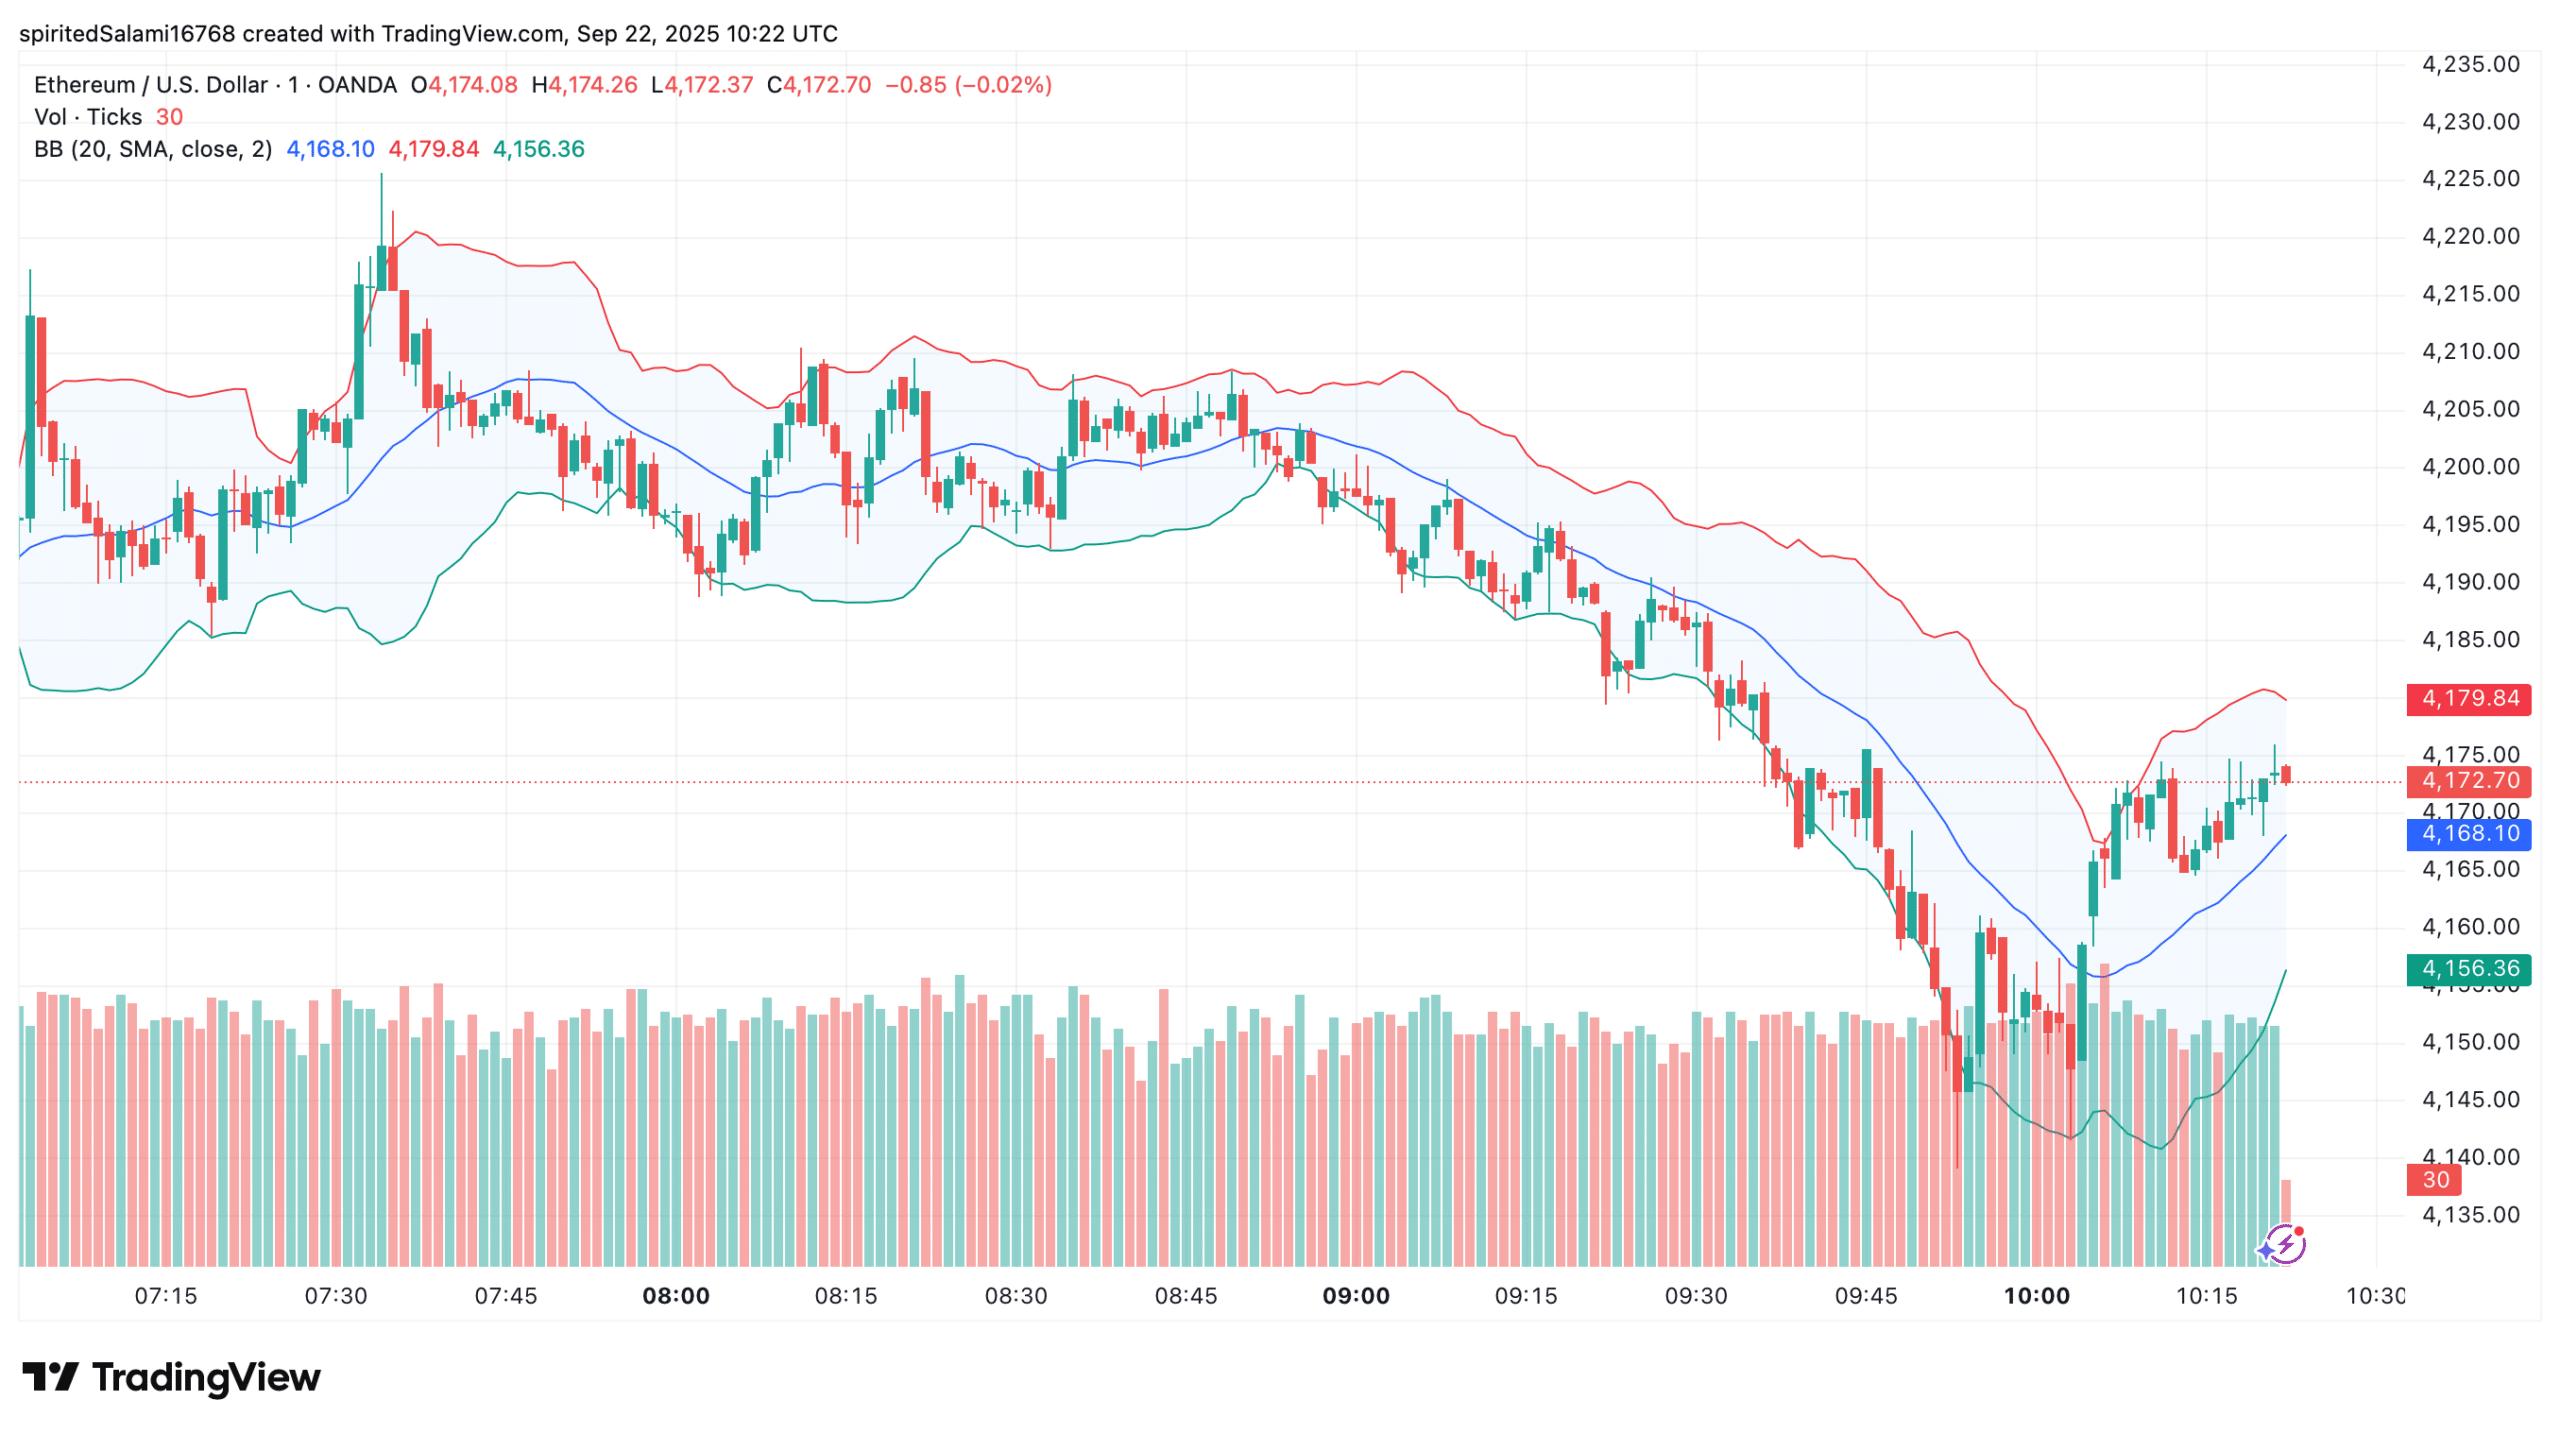
Yes. In cryptocurrency markets, Bollinger Bands adapt to changing volatility. When prices become more volatile, the outer bands widen. When prices calm down, the bands contract. This makes them especially useful on candlestick charts for visualizing real-time market conditions across any timeframe and any trading pair listed on a crypto exchange.
Read more: How to Read Crypto Candlestick Charts
Bollinger Bands act as a quick-read dashboard for market conditions. Here’s what they can reveal.
Price Volatility
The widening or narrowing of the outer bands reflects shifts in market volatility. When the bands expand, volatility is high and prices are moving strongly. When they contract, volatility is low and the market is consolidating.
Overbought and Oversold Conditions
Touches or closes above the upper band can signal that an asset is overbought, while touches or closes below the lower band may suggest oversold conditions. These signals aren’t guarantees of reversal but give traders a context for judging price extremes.
Trend Strength and Continuation
A “band walk” (where price repeatedly rides along the upper or lower band) often indicates a strong trend that can continue. Seeing price hug one band without reversing immediately warns against prematurely betting on a reversal.
Mean Reversion Potential
Because the middle band represents the average, price often drifts back toward it after moving far away. Traders use this tendency to identify potential entry or exit points based on mean reversion.
Breakout Warnings (Band Squeeze)
A pronounced narrowing of both bands, known as a “Bollinger squeeze,” signals that volatility has compressed and a breakout is likely. Traders watch for a strong move outside the bands to confirm the start of a new trend after the squeeze.
Read more: Key Technical Indicators in Crypto Trading
Bollinger Bands work by overlaying a dynamic “envelope” around price. This envelope adjusts automatically as market conditions change, showing how far price has strayed from its average. By combining a moving average with a volatility measure, traders can see not only the trend but also whether price is unusually high or low relative to recent action.
At the core of every Bollinger Band setup is a simple moving average of closing prices over a chosen lookback period. This average forms the middle band. Above and below it sit the upper and lower bands, which are calculated by adding and subtracting a multiple of the standard deviation of price. When volatility rises, the bands widen. When volatility drops, they tighten.
In practice, traders don’t calculate these figures by hand. Modern charting platforms and crypto exchanges plot Bollinger Bands automatically once you select the indicator and set your preferred parameters such as period length and standard-deviation multiplier.
Applying Bollinger Bands is pretty straightforward. Open a candlestick chart of your chosen trading pair on your exchange or charting platform. From the indicators menu, add Bollinger Bands. You can leave the default settings or adjust the lookback period, the standard-deviation multiplier, and the timeframe to match your trading style. Many traders also overlay complementary tools like the Relative Strength Index (RSI) or Keltner Channels to confirm signals and improve context.
Bollinger Bands aren’t just for visual analysis: they can be the backbone of a structured trading strategy.
Traders look for prices that have moved far above or below the bands, expecting them to revert toward the middle band. Entry is taken when a candle closes outside the band and then back inside. Exits occur near the middle line or previous support and resistance levels.
When to use it. Best in sideways or range-bound markets where price oscillates between highs and lows rather than trending strongly.
Learn how to spot scams and protect your crypto with our free checklist.

A squeeze happens when the upper and lower bands contract significantly, indicating low volatility. Traders monitor for a decisive breakout of price beyond either band, often confirmed by higher volume or a strong candlestick close.
When to use it. Useful when a large move is expected. The squeeze acts as an early warning of impending market volatility.
In a strong uptrend, traders look for price to “walk” along the upper band, entering long positions on pullbacks toward the middle band and exiting on signs of exhaustion. In a downtrend, the same logic applies using the lower band.
When to use it. Best when clear momentum exists and price is steadily hugging one band, signaling strength rather than imminent reversal.
Combine Bollinger Bands with the Relative Strength Index. When price touches or closes outside a band while the RSI shows overbought or oversold conditions, traders look for a reversal back toward the middle line.
When to use it. Suitable for catching turning points after extreme moves, especially when market sentiment is stretched.
Plot two sets of Bollinger Bands with different standard-deviation multipliers (for example, one at 1 standard deviation and another at 2). The inner bands define a “normal” zone, and the outer bands show the extremes. Positions are taken based on which zone price enters.
When to use it. Helpful for filtering trades and identifying stronger signals, especially in volatile crypto markets.
Bollinger Bands help traders see when crypto prices are stretched or consolidating. By following the steps below on your price chart, you can turn this indicator into a practical tool for planning entries and exits.
Focus first on the middle band—a simple moving average of closing prices over your chosen lookback period. It marks the short-term mean and often acts as a reference for support or resistance.
In our day and age, there’s no need to calculate or plot anything yourself. Just open your charting platform and check the default parameters for Bollinger Bands. Make sure the lookback period, standard-deviation multiplier, and timeframe fit your trading style. This ensures the upper Bollinger Band and lower Bollinger Band reflect the market conditions you’re analyzing.
Look at how price interacts with the bands. The upper Bollinger Band highlights the upper limit of typical price action, and the lower band shows the lower limit. Watch for touches, closes outside, or moves back inside—these are the raw “signals” you’ll use for entries and exits.
Read the bands’ shape:
Repeated closes near the upper Bollinger Band can confirm strong momentum, while reversals from either band may signal a shift back toward the middle. Indicators such as %B and Bollinger Bandwidth give a numerical view of these conditions if you prefer data over visuals.

Enter and exit based on what the bands show. In ranges, consider buying near the lower Bollinger Band and taking profit near the upper Bollinger Band or the middle one. In trends, use pullbacks to the middle band to join the move. Combine this with stop-loss and take-profit orders for risk management, and backtest your plan over different timeframes and trading pairs.
Bollinger Bands give crypto traders clear visual cues for volatility, extremes, and breakouts. Trading without them means relying on raw price data or other indicators.
Bollinger Bands are a popular technical analysis tool in crypto and other financial markets, but they’re not magic. They can improve your view of a price chart, yet relying on them alone can lead to mistakes.
First, Bollinger Bands only measure past price movements. They don’t predict the future. The upper band and lower band shift with every new candle, so any “signal” you see is reactive, not predictive.
Second, different settings can produce very different upper band signals, which means two traders might interpret the same chart in totally different ways.
Third, like most technical indicators, Bollinger Bands can fail during strong news-driven moves or thin liquidity, when price slices through the upper band or lower band without reverting. And all cryptocurrency traders know how common that is in crypto.
Finally, they work best when combined with other tools and well-tested trading strategies. Without confirmation from volume, price action, or complementary indicators, the bands alone can generate false breakouts or premature entries.
Here are some tips for using Bollinger Bands that focus on what actually works in live markets, not just theory.
Read more: Crypto Risk Management Strategies
Bollinger Bands remain a go-to indicator because they translate raw volatility into a clear visual framework. Used correctly, they help crypto traders spot momentum, overextension, and low-volatility setups before a move. But they’re not a stand-alone system—combine them with sound risk management, complementary indicators, and disciplined trade planning to build crypto trading strategies you can trust across timeframes and market conditions.
It depends on your crypto trading strategy and goals. Shorter timeframes give more frequent data points and signals but can be noisy, while daily charts filter noise and show stronger trend or sell signals in the opposite direction of short-term moves.
Yes. Combining Bollinger Bands with MACD or volume analysis adds confirming data points for entries and exits, helping you avoid reacting to a single indicator’s false sell signals.
The calculation is the same, but crypto’s 24/7 trading and higher volatility mean more frequent band touches and squeezes. This can produce quicker breakouts and sell signals or reversals in the opposite direction than you’d expect in slower markets.
Disclaimer: Please note that the contents of this article are not financial or investing advice. The information provided in this article is the author’s opinion only and should not be considered as offering trading or investing recommendations. We do not make any warranties about the completeness, reliability and accuracy of this information. The cryptocurrency market suffers from high volatility and occasional arbitrary movements. Any investor, trader, or regular crypto users should research multiple viewpoints and be familiar with all local regulations before committing to an investment.
The post What Are Bollinger Bands and How to Use Them in Crypto Trading appeared first on Cryptocurrency News & Trading Tips – Crypto Blog by Changelly.


