Following a period of consolidation, Ethereum price is currently trading around the $2,240 mark, showing a steady climb from its March lows. As institutional interest remains a driving force, particularly through Ethereum spot ETFs, technical patterns on the 4-hour chart suggest that a major volatility event is on the horizon.
The 4-hour chart reveals a classic "stairs up" pattern. After the sharp dip highlighted by the green circle at the $1,800 level, $Ethereum has formed a series of higher highs and higher lows.
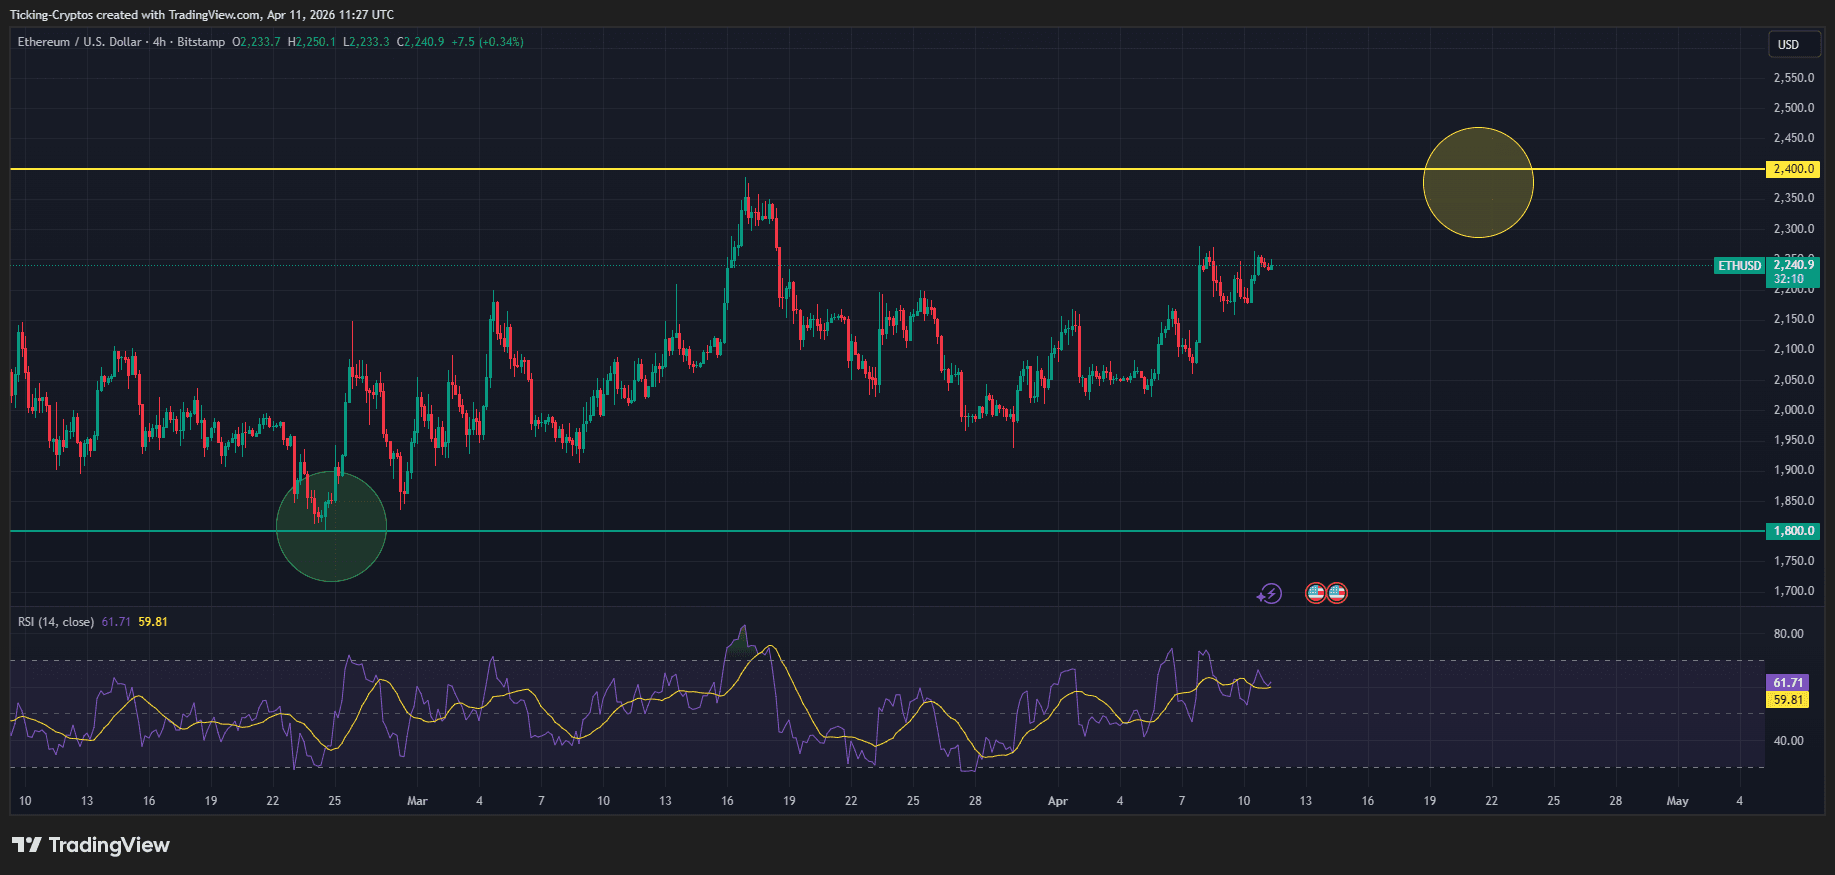
The Target ($2,400): Highlighted by the yellow circle, this is the "make or break" point. A breakout above this level, supported by high volume, could open the doors toward the $2,800 range.
| Indicator | Value | Signal |
|---|---|---|
| Current Price | $2,240.9 | Bullish |
| RSI (14) | 61.71 | Strong Momentum |
| Support 1 | $2,150 | Immediate |
| Support 2 | $1,800 | Macro Floor |
While the technicals look promising, the "Why" behind the move is equally important. According to data from Bloomberg, institutional accumulation of Ethereum has stabilized after a volatile Q1.
Furthermore, Ethereum's ecosystem continues to expand following the "Glamsterdam" upgrade scheduled for the first half of 2026. The reduction in exchange-held supply suggests that investors are moving ETH into hardware wallets for long-term storage, effectively reducing selling pressure.
No analysis is complete without considering the downside. While the RSI at 61.71 is healthy, a spike above 70 often precedes a local "top" or a cool-off period. If Ethereum fails to clear the $2,400 resistance on its first attempt, we might see a return to the $2,100 level to shake out late "long" positions.
Ethereum remains in a structurally sound uptrend. The combination of rising RSI, successful support retests, and positive institutional sentiment positions ETH as a frontrunner for the next leg of the crypto market rally.

