
The US natural gas price forecast is closely monitored by traders as volatility in global energy markets continues to increase.
Prices in the United States are influenced by several key factors, including domestic production, storage levels, LNG exports, and weather conditions. Geopolitical developments affecting global energy supply have also become an increasingly important factor influencing natural gas price movements.
As the United States has become a major natural gas exporter, domestic prices are now more closely linked to global demand trends. Understanding these key drivers may help traders assess potential price trends and evolving conditions in natural gas markets.
This article examines the main factors and expert projections shaping US natural gas price predictions over the next 5 years.
Analytical natural gas price forecasts in 2026 range from $3.00 to $3.90 per MMBtu. The EIA projects US natural gas prices at $3.76 and the S&P Global Ratings at $3.75. The wide spread reflects uncertainty around how quickly new LNG export capacity will absorb rising production. Meanwhile, production is expected to reach record levels of 118 Bcf/d.
Analytical outlooks for 2027 widen further, from $2.88 to $4.17. The EIA projects $3.85 and the S&P Global Ratings forecasts $3.75. Demand is expected to outpace supply for the first time in several years, driven by LNG exports projected to reach 18.1 Bcf/d.
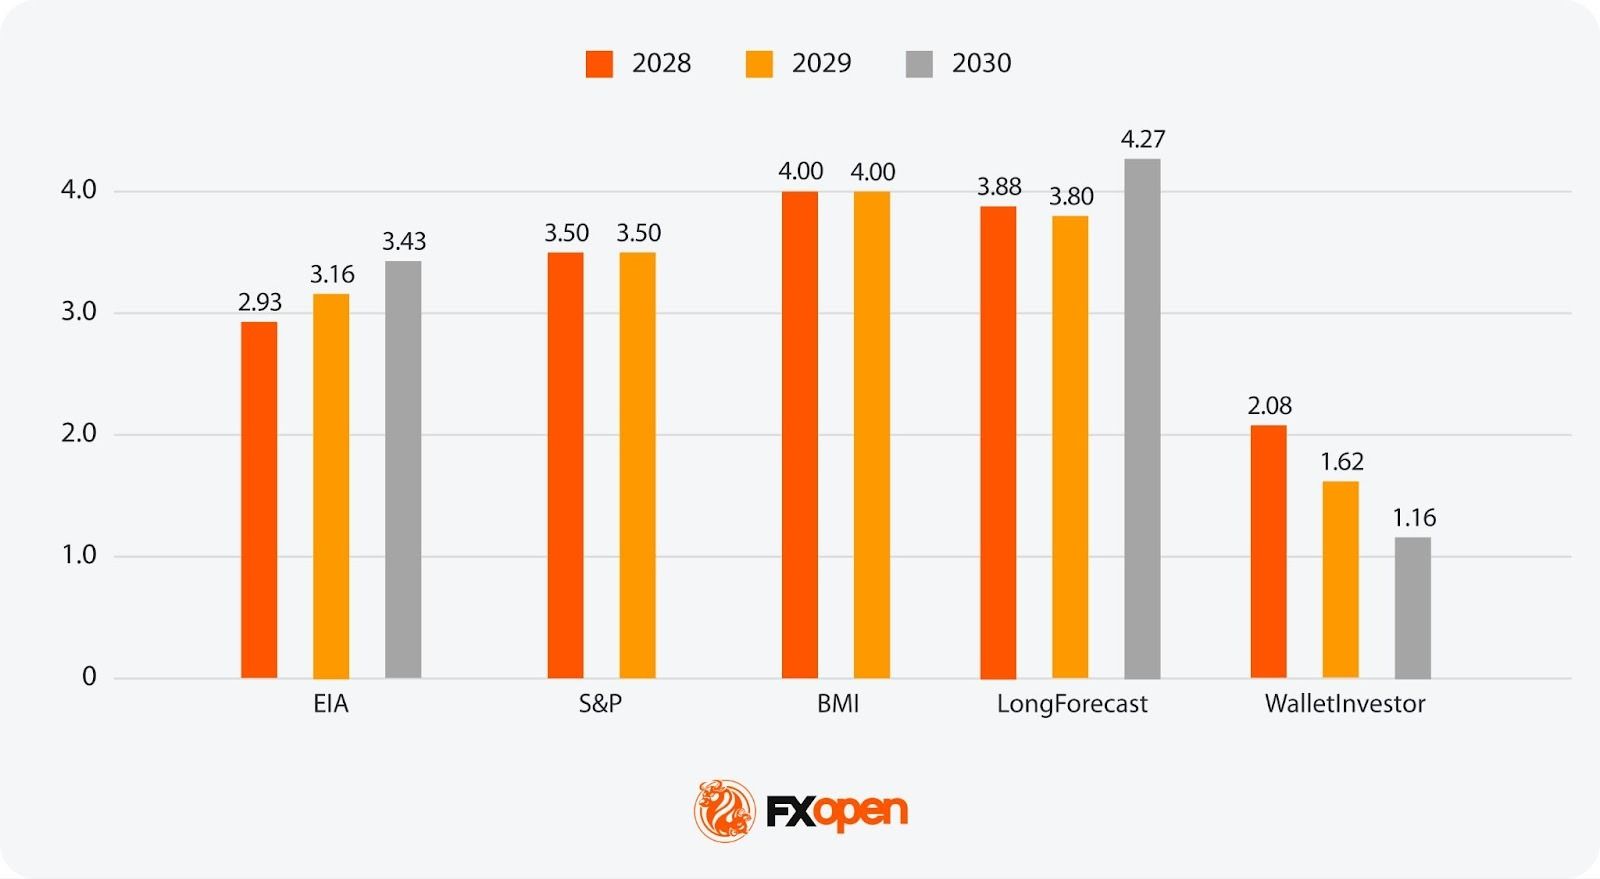
In 2028, analytical US natural gas price projections range from $2.08 to $4.00. The S&P Global Ratings expects US natural gas prices at $3.50 in 2028. Fewer institutions publish firm figures this far out. By 2028, most new US LNG terminals are expected to be operating near full capacity, locking in a structural floor under domestic demand.
Available outlooks for 2029 range from $1.62 to $4.00. The S&P Global Ratings anticipates the US natural gas prices at $3.50 in 2029. The question is whether Haynesville and Permian production can scale fast enough to meet growing export and power sector demand.
In 2030, US natural gas price projections diverge from $1.16 to $4.27, with the EIA's AEO 2025 reference case at $3.43. The wide range reflects genuine uncertainty around renewable energy displacement, data centre gas demand, and whether global LNG markets tip into oversupply as Qatari and other capacity comes online.
The history of natural gas prices at Henry Hub, the US benchmark, reflects the market’s volatility and sensitivity to external factors. Here's a look at some of the most notable periods since 2000:
The US had entered the 2024-25 winter with its largest gas stockpile since 2016, but cold weather drew down storage rapidly. Meanwhile, new LNG export terminals, Plaquemines LNG in Louisiana and Corpus Christi Stage 3 in Texas, ramped up shipments faster than expected. This pushed US LNG exports up roughly 25% year-on-year to around 15 Bcf/d. With demand rising and production growth remaining relatively flat, the Henry Hub annual average nearly doubled the 2024 level at around $4.30/MMBtu.
Early 2026 brought further volatility. Winter Storm Fern sent the Henry Hub spot price briefly above $7/MMBtu. However, milder February weather brought prices back down toward the $3-3.50 range. As of March 2026, the EIA expects the Henry Hub to average around $3.80/MMBtu for the full year. Rising production and growing electricity demand from data centres may play a key role.
Several factors are shaping future natural gas price predictions in 2026 and 2027.
US marketed natural gas production is on track to reach record levels. The EIA projects output to average 118 Bcf/d in 2026 and 121 Bcf/d in 2027, up from 116 Bcf/d in 2025. Around 69% of growth may come from the Haynesville, Permian, and Appalachia regions. The Haynesville is set to overtake the Permian as the leading source of growth in 2027, supported by its proximity to Gulf Coast LNG terminals.
US inventories are expected to end the 2025-26 winter at around 1,840 Bcf, roughly in line with the five-year average. Winter Storm Fern in January drove a record weekly withdrawal, but higher-than-expected production and milder February weather helped cushion the drawdown.
Three new facilities (Plaquemines LNG, Corpus Christi Stage 3, and Golden Pass LNG) are ramping up through 2026-27. The EIA sees US LNG exports rising to 16.7 Bcf/d in 2026 and 18.1 Bcf/d in 2027. Globally, LNG supply growth is expected to accelerate to more than 7% in 2026, its fastest pace since 2019, according to the IEA.
The IEA expects global gas demand growth to accelerate to nearly 2% in 2026, driven by China and emerging Asian markets. The World Bank's October 2025 Commodity Markets Outlook notes that US and European gas price paths are diverging. The US benchmark is projected to rise moderately in 2026 before stabilising, while European prices are expected to decline. Geopolitical tensions, particularly disruptions to LNG flows through the Strait of Hormuz, remain an upside risk.
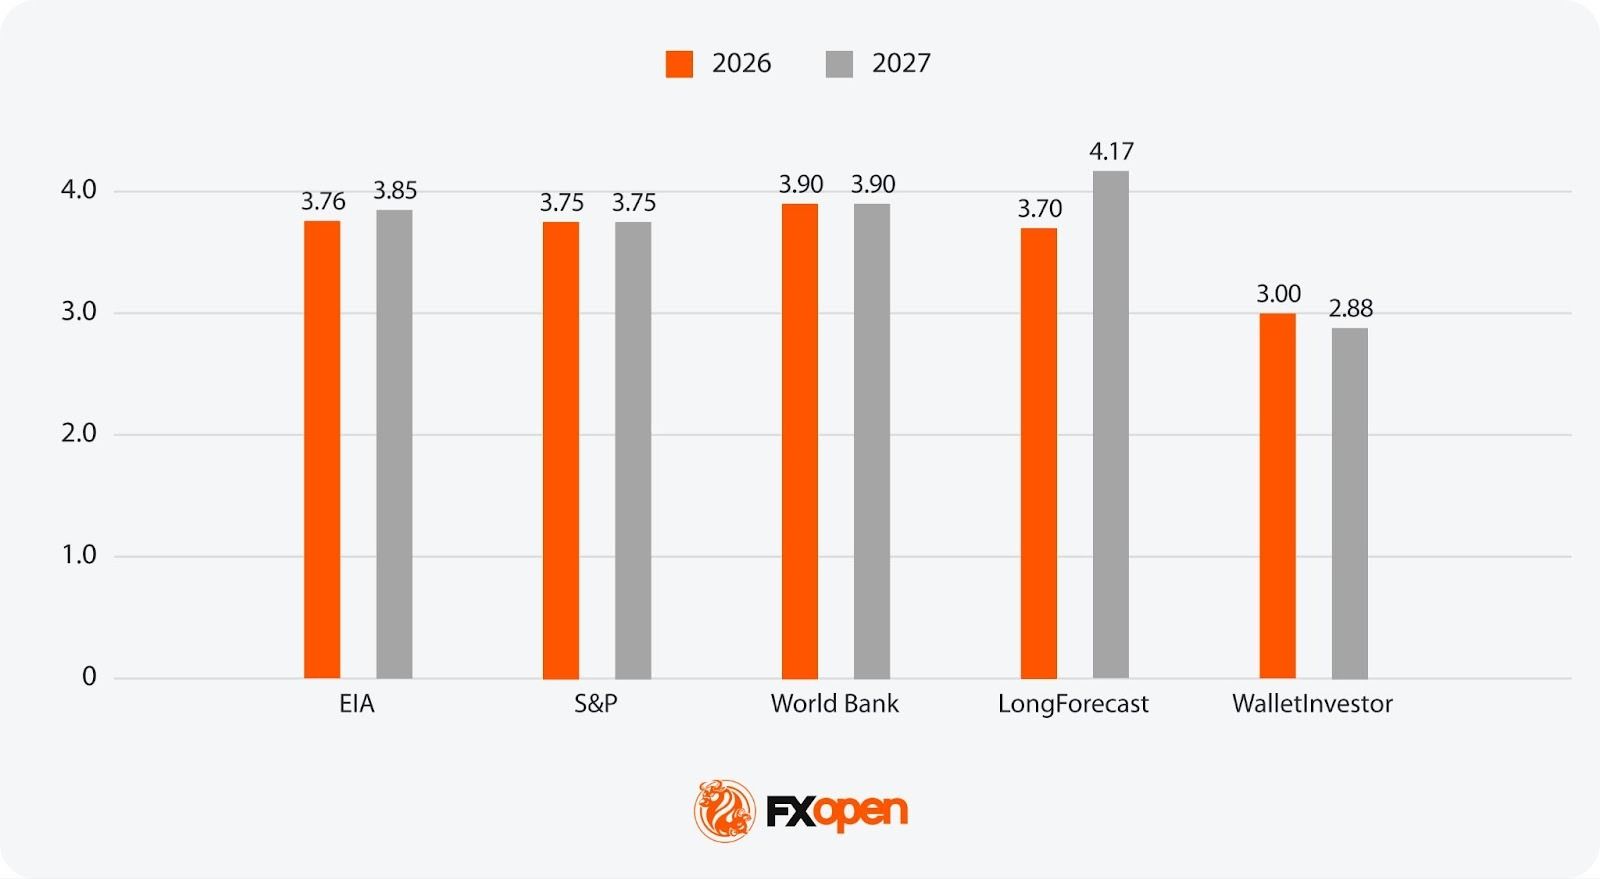
The EIA currently sees the Henry Hub averaging around $3.76/MMBtu in 2026, rising to $3.85/MMBtu in 2027. S&P Global Ratings projects that Henry Hub prices will be stable around $3.75/MMBtu in both years, driven by an oversupply relative to demand. The World Bank's October 2025 outlook projected the US benchmark to rise by around 11% in 2026 to $3.90/MMBtu. Risks will be tilted to the upside from geopolitical disruption and faster-than-anticipated data centre demand.
Fewer institutions publish firm natural gas price predictions over the next 5 years, so the range of estimates widens. The key question is whether growing demand from LNG exports and power generation will outpace production growth and renewable displacement.
The policy landscape has shifted. The current US administration has taken a supportive stance towards fossil fuel production and slowed federal support for renewables deployment. The EIA's Annual Energy Outlook 2025 projects natural gas retaining a roughly 40% share of US electricity generation through the late 2020s. However, it will then decline as renewables scale up in the 2030s. Note: the outlook assumes only laws and regulations in place as of December 2024.
However, RBAC and other analysts have noted that the AEO's aggressive renewable projections may already be outdated given recent policy reversals. The role of gas-fired generation could extend further than the reference case implies.
Despite policy headwinds in the US, global renewable deployment continues at pace. The IEA's Electricity 2026 report projects gas-fired generation will grow by an average of 2.6% per year through 2030. The growth drivers are US electricity demand and Middle Eastern fuel switching - even as renewables and nuclear together reach 50% of global electricity generation by 2030. In other words, gas and renewables are both growing in the power sector through 2030, though gas loses market share in percentage terms.
Electricity demand from data centres remains the wildcard. East Daley Analytics projects 4-6 Bcf/d of additional gas demand by 2030 from data centres alone. Other estimates range as high as 10 Bcf/d. If even the lower end materialises, it would represent a meaningful tightening force by 2028-2030, particularly in regions like Texas and the US Southeast where gas-fired generation is expected to serve much of this new load.
An unprecedented wave of new LNG export capacity is scheduled to come online by 2030. The IEA's World Energy Outlook 2025 puts new annual LNG export capacity at around 300 bcm by 2030, a roughly 50% increase on today's global supply. Around half of this is being built in the US, with Qatar accounting for a further 20%. This sustained export pull is a key reason most medium-term outlooks see US gas prices firming rather than declining.
The EIA's AEO 2025 reference case projects the Henry Hub reaching around $3.80/MMBtu by 2030. A high-price scenario above $5.00/MMBtu is possible if LNG demand from Asia and data centre power accelerate faster than expected.
BMI (Fitch Group) projects $4.00/MMBtu across 2028-2029, with the Bloomberg consensus in a similar range. Both assume LNG export growth tightens domestic balances but is partially offset by continued production gains.
Energy executives surveyed by the Dallas Fed in Q4 2025 expect the Henry Hub to average $5.00/MMBtu five years out. The forecast reflects confidence that rising LNG exports, data centre demand, and coal plant retirements will structurally tighten the market.
The price of natural gas is subject to many factors that influence its market dynamics, affecting both supply and demand. Here's an overview of its critical driving forces:
Natural gas traders typically track several data points to inform their market view.
EIA weekly storage reports. The EIA's Weekly Natural Gas Storage Report is one of the most closely watched releases in the energy market. It shows the net change in underground storage inventories. Deviations from consensus expectations often trigger sharp price moves in NYMEX futures.
Production and rig count data. Production and rig count data provide a read on supply trends. The EIA publishes monthly production figures, while Baker Hughes releases weekly rig counts that signal future drilling activity in key basins like the Haynesville and Permian.
Weather forecasts. Weather data is another core input. Temperature outlooks from the National Oceanic and Atmospheric Administration (NOAA) and private forecasters shape expectations for heating and cooling demand. This can shift the front end of the futures curve within hours.
Technical analysis. Many traders also apply technical analysis to price charts, using tools like moving averages, support and resistance levels, and volume patterns.
Through an FXOpen account, traders may access natural gas price movements via CFDs, with real-time market data available on the TickTrader platform.
In summary, US natural gas prices are likely to remain highly responsive to changes in supply, LNG exports, weather patterns, and geopolitical developments in global energy markets.
Changes in production levels, storage dynamics, and global energy trade may continue to influence price movements and volatility.
For traders, monitoring these fundamental drivers may help provide a clearer understanding of market dynamics. Through an FXOpen account, traders can access real-time market data and analytical tools to follow natural gas price movements and trade the commodity via CFDs.
Analyses from agencies and institutions point to a gradual firming in US natural gas prices through the rest of the decade. The rise is driven by rising LNG export demand and growing power sector consumption. However, projections vary widely depending on assumptions about production growth, renewable energy adoption, and geopolitical developments. Moderate volatility is expected to persist.
For 2026, analytical projections range from around $3.00 to $3.90/MMBtu depending on the source. The EIA's March 2026 short-term outlook sees the Henry Hub averaging $3.76/MMBtu, while the World Bank projects $3.90. Key variables include winter weather severity, LNG export ramp-ups, and the pace of Permian and Haynesville production growth.
As of 16 March 2026, Henry Hub natural gas is trading at around $3.05/MMBtu. Prices fluctuate throughout each trading session. Visit FXOpen's TickTrader platform and search for US natural gas (XNG/USD) to follow live quotes and intraday movements.
Investing in natural gas depends on market analysis and personal investment goals. The market’s potential volatility and future growth prospects are key considerations. Some market participants use instruments such as US natural gas CFDs to gain exposure to short-term price movements.

