
At the end of February, Netflix withdrew from the bid for Warner Bros. Discovery assets after WBD’s board deemed Paramount Skydance’s $31-per-share offer more attractive. Netflix chose not to raise its own bid of $27.75 per share and received compensation of $2.8 billion. The market reacted positively to the company’s exit from the months-long M&A battle, as the threat of adding more than $40 billion in debt to the balance sheet was removed.
The second key event was the company’s Q1 2026 earnings report, released on 16 April. Revenue reached $12.25 billion (+16% year-on-year), while earnings per share came in at $1.23, exceeding consensus forecasts. However, guidance for Q2 fell short of analysts’ expectations for both revenue and EPS, while company founder Reed Hastings announced plans to step down from the board in June. Together, these factors triggered a sharp negative market reaction in April.
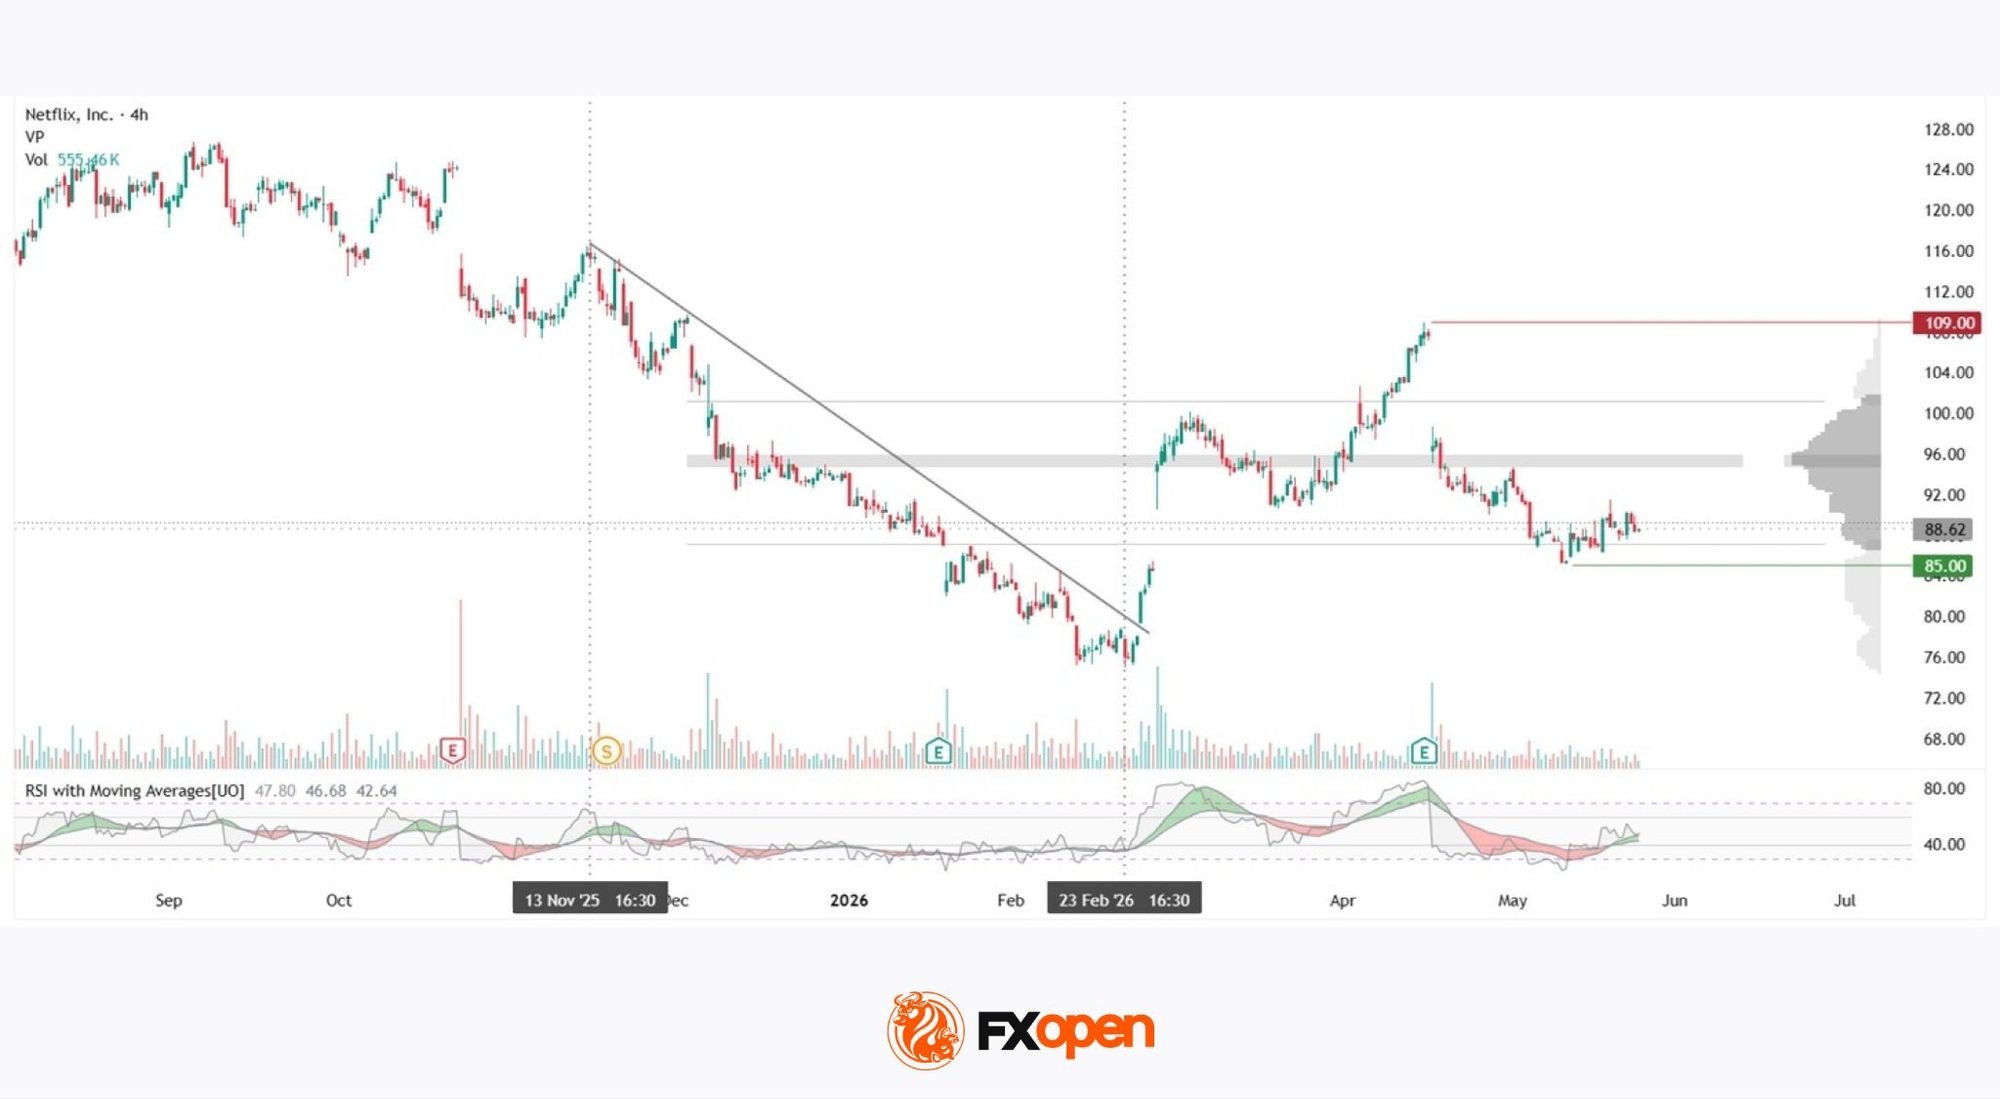
The long-term downtrend in Netflix shares began in July 2025, when the stock was trading near historic highs around $134. The period from 13 November 2025 to 23 February 2026 marked the final phase of this trend, during which the price declined towards $75.
The gap on 27 February 2026 — a direct consequence of the company’s withdrawal from the WBD deal — broke the descending trendline and was accompanied by an abnormal surge in vertical trading volume. The subsequent rally pushed the stock towards $109, which may now act as a resistance zone on any renewed advance. The gap on 17 April reversed the move lower, also on elevated volume, returning the price to the range of the current volume profile.
At present, the shares are trading slightly above the lower boundary of the profile, while the Point of Control (POC) zone lies around $94.50–$96.00 and may serve as a reference point in the event of a recovery. The $85.00 area could become the nearest significant support below the profile. RSI with moving averages currently shows readings of 47 / 46 / 42 — all three lines remain below the 50 mark and have yet to form any impulsive structure.
Netflix’s technical structure reflects two polar opposite events within the same year: the breakout of the long-term downtrend following a corporate event, and the subsequent correction after disappointing guidance. The stock’s next direction will largely depend on whether the market can hold above the lower boundary of the profile and how convincing the company’s operational progress proves to be in Q2.





