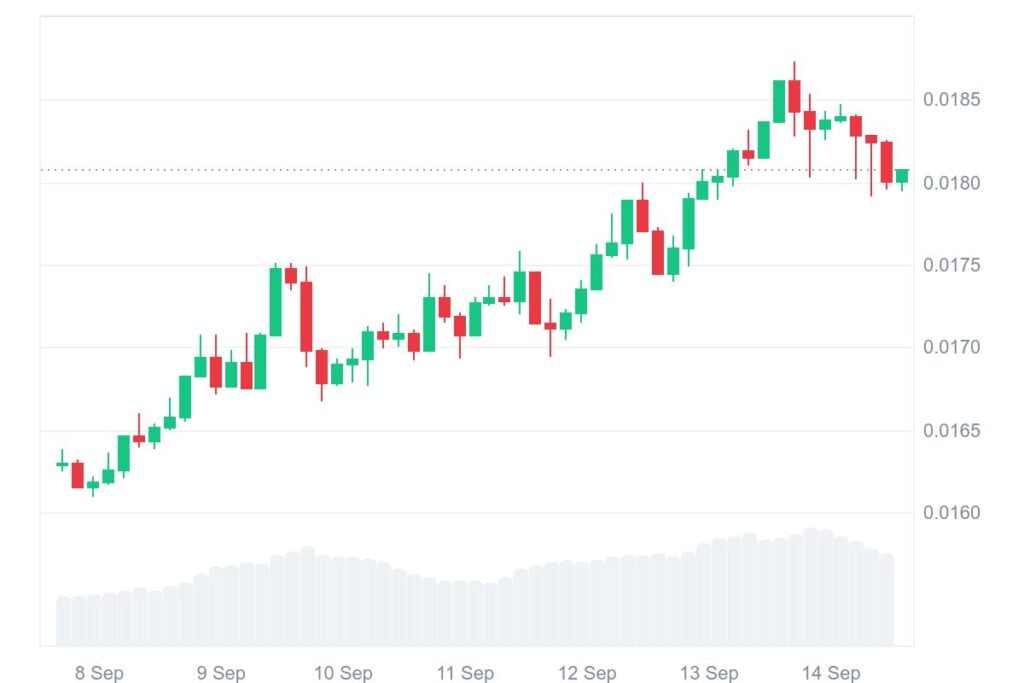
Gala remains under pressure, reflecting mixed market conditions across the crypto space. Over the last 24 hours, the token has slipped by nearly 2.88%. In contrast, its weekly performance shows a notable 10.58% gain, underlining its resilience in volatile trading conditions.
At the time of writing, Gala is trading at $0.01795. Its 24-hour trading volume stands at $101.04 million, down 15.38% from the previous session. Meanwhile, market capitalization holds at $825.62 million. The drop in trading activity shows caution among traders as they await stronger confirmation of a breakout.
Also Read: GALA Price Targets $0.0430 as Breakout Signals Strong Momentum
According to crypto analyst Jonathan Carter, the GALA chart on the 2-day timeframe shows a breakout from a symmetrical triangle that had been developing since March 2024. This pattern, marked by converging highs and lows, suggests consolidation ahead of a directional move. Gala has now broken above the descending resistance line, a sign of renewed buying interest.
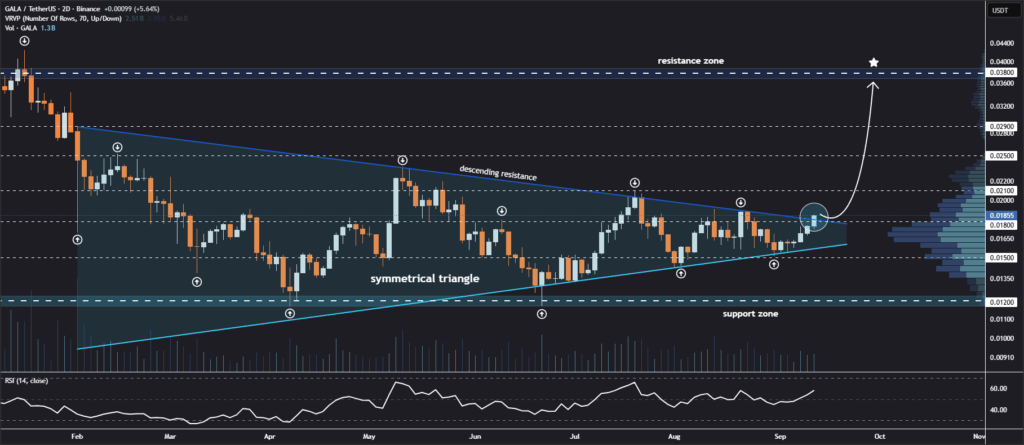
The token is currently trading just above its former resistance zone of $0.017–$0.018. If this range holds during retesting, buying pressure could accelerate. Key target levels sit at $0.021, $0.025, $0.029, and the $0.038–$0.040 resistance zone.
The Volume Profile also shows a low-volume gap between $0.021 and $0.038, signaling limited resistance if Gala clears the first target. However, traders remain cautious of false breakouts. Not holding at higher levels than $0.017 could see the token back in its triangle, and tighter support is in the area of $0.012.
The RSI in the daily chart is recorded at 58.32, moving higher beyond its 51.58 moving average. The RSI is well situated above the 50-neutral level, reflecting stable buying demand. Importantly, it is lower than its overbought 70 level, giving leeway for a larger price action in front of potential exhaustion.
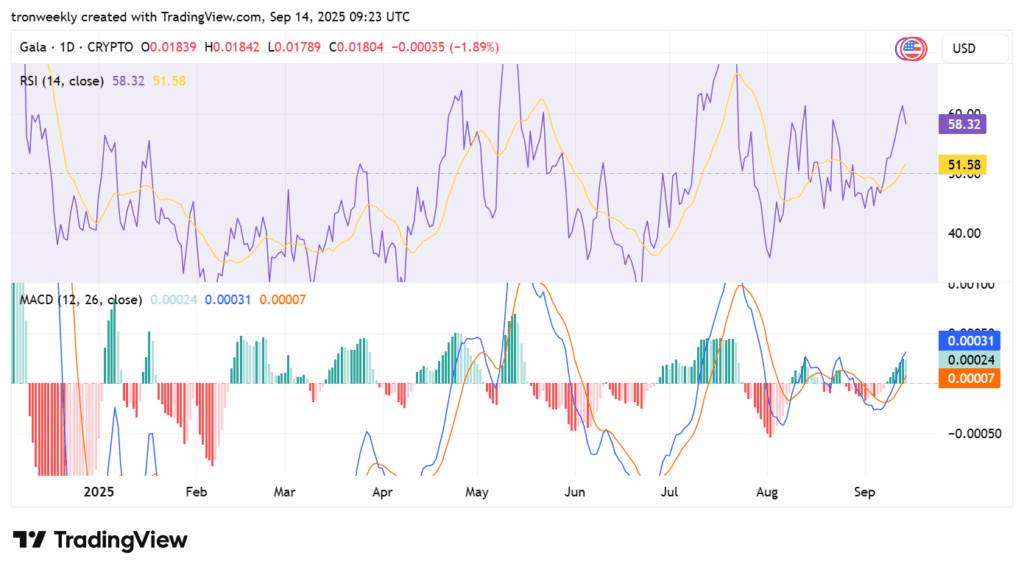
The Moving Average Convergence Divergence (MACD) indicator verifies this bullish case. The MACD line is at 0.00031, considerably higher than the signal line at 0.00007, confirming a bullish crossover. The histogram is gaining positively, lending additional thrust to the breakout case. This technical validation, coming after a phase of sideways movement, supports the possibilities of upside momentum in the days ahead.
Together, the MACD and RSI confirm that Gala’s momentum continues building strength. If volume is commensurate with a successful retest, a move to higher levels of resistance is ahead for Gala.
Also Read: GALA May Soon Break Out and Surge by 130%: Analyst Says


