
GMT price prediction signals downside as technical structure and derivatives data confirm a bearish continuation setup. Following its failure to hold at or above the $0.0115 resistance level, the GMT crypto price has weakened significantly. It currently faces immense pressure from sellers.
GMT crypto price is under bearish downward pressure as it stalls at a critical resistance level. The crypto was unable to hold above the $0.0115 resistance zone, which would have confirmed a reversal of direction upward.
As reported by CoinMarketCap, the GMT price is currently valued at approximately $0.01138 (down 3.5%) over the past 24 hours. Sellers are now taking control of the market structure due to a rejection of price near a key supply area.

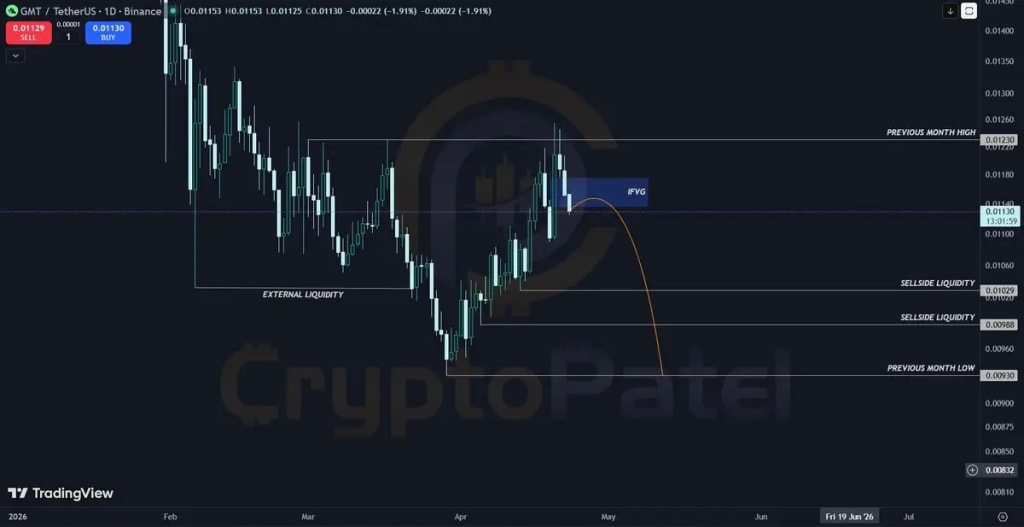
Crypto Patel’s bearish continuation setup outlined on X showed this GMT price analysis. The analyst explained that the GMT crypto tapped into an inverse fair value gap and demonstrated weak continuation.
When price demonstrates weak continuation like this, it usually means there will be a move toward areas of lower liquidity.
Also Read | Solana Price Prediction 2026-2032: Can SOL Reach $668 by 2032?
GMT price prediction suggests a continued move toward lower liquidity zones on the sell side. The current bearish sentiment surrounding the crypto is reinforced by technical indicators, which suggest a continuation of the downward trend.
When price rejects internal liquidity zones, it can indicate that sellers are actively defending these levels. The longer-term structure remains negative, limiting upside potential and reinforcing downside potential.
Crypto Patel identifies specific price targets for GMT, including $0.01029, $0.00988, and $0.00930. For invalidation to occur, Crypto Patel expects to see a daily close for GMT above $0.01270.
According to this GMT price analysis, a structurally driven move toward lower-liquidity zones on the sell side is expected.
This GMT price prediction is supported by CoinGlass data, showing slightly bearish sentiment across GMT futures markets. Open interest has declined by over 8%.
This suggests less speculative activity in terms of futures contracts. Conversely, trading volume has increased by nearly 7% over the same period.
Traders are repositioning themselves in response to changing market conditions. The long-to-short ratio on futures contracts for GMT shows a relatively neutral position.
It appears that traders are undecided on whether to take long or short positions on GMT futures contracts. Although top traders on Binance appear to have more long positions than short positions, liquidation data says otherwise.
More than $25,000 in long positions were liquidated. The downward volatility forced long traders to exit their positions, resulting in over $25,000 in liquidation costs.
Funding rates being slightly positive suggest that there is lingering bullish sentiment even though price action is weak.

All the major technical indicators on the 4-hour TradingView chart show weak momentum. Currently, the GMT price is trading beneath the 20 EMA and is struggling to get through the 50 EMA resistance.
The 200 EMA lies beneath the price, providing support near $0.0111. The RSI reading of 43 indicates no oversold condition but does indicate that further downward price movements are possible.
The MACD shows a bearish crossover with decreasing histogram strength, indicating that momentum is fading and selling pressure is increasing.

GMT price prediction remains bearish unless bulls are able to reclaim the $0.01270 resistance zone. Failure to break through this price level increases the chances of a drop in price to $0.00930.
Traders may watch for reversal or rejection signals to enter into short trades. This price action currently favors the sellers with continued weakness in momentum.
This article contains market analysis and price predictions. These are not guarantees. Crypto markets are volatile. Always DYOR. Not financial advice.
Also Read | Celestia (TIA) Price Trend Suggests Gradual Reversal Toward $0.40 Breakout

