
Gold price extended losses below $4,800 before the bulls appeared. WTI Crude oil prices are rising and could climb further higher toward $92.00.
· Gold price failed to clear $4,900 and declined steadily against the US Dollar.
· There is a key bearish trend line forming with resistance at $4,815 on the hourly chart of gold at FXOpen.
· WTI Crude oil prices are moving higher above the $85.00 pivot zone.
· There is a connecting bearish trend line forming with resistance at $89.10 on the hourly chart of XTI/USD at FXOpen.
On the hourly chart of Gold at FXOpen, the price failed to settle above $4,900 and reacted to the downside, as discussed in the previous analysis. The price traded below $4,850 and $4,800 to enter a short-term bearish zone.
There was a sharp drop below $4,750. The price settled below the 50-hour simple moving average, and RSI dipped below 40. Finally, it tested the $4,700 zone. A low was formed at $4,699, and the price is now correcting some losses.
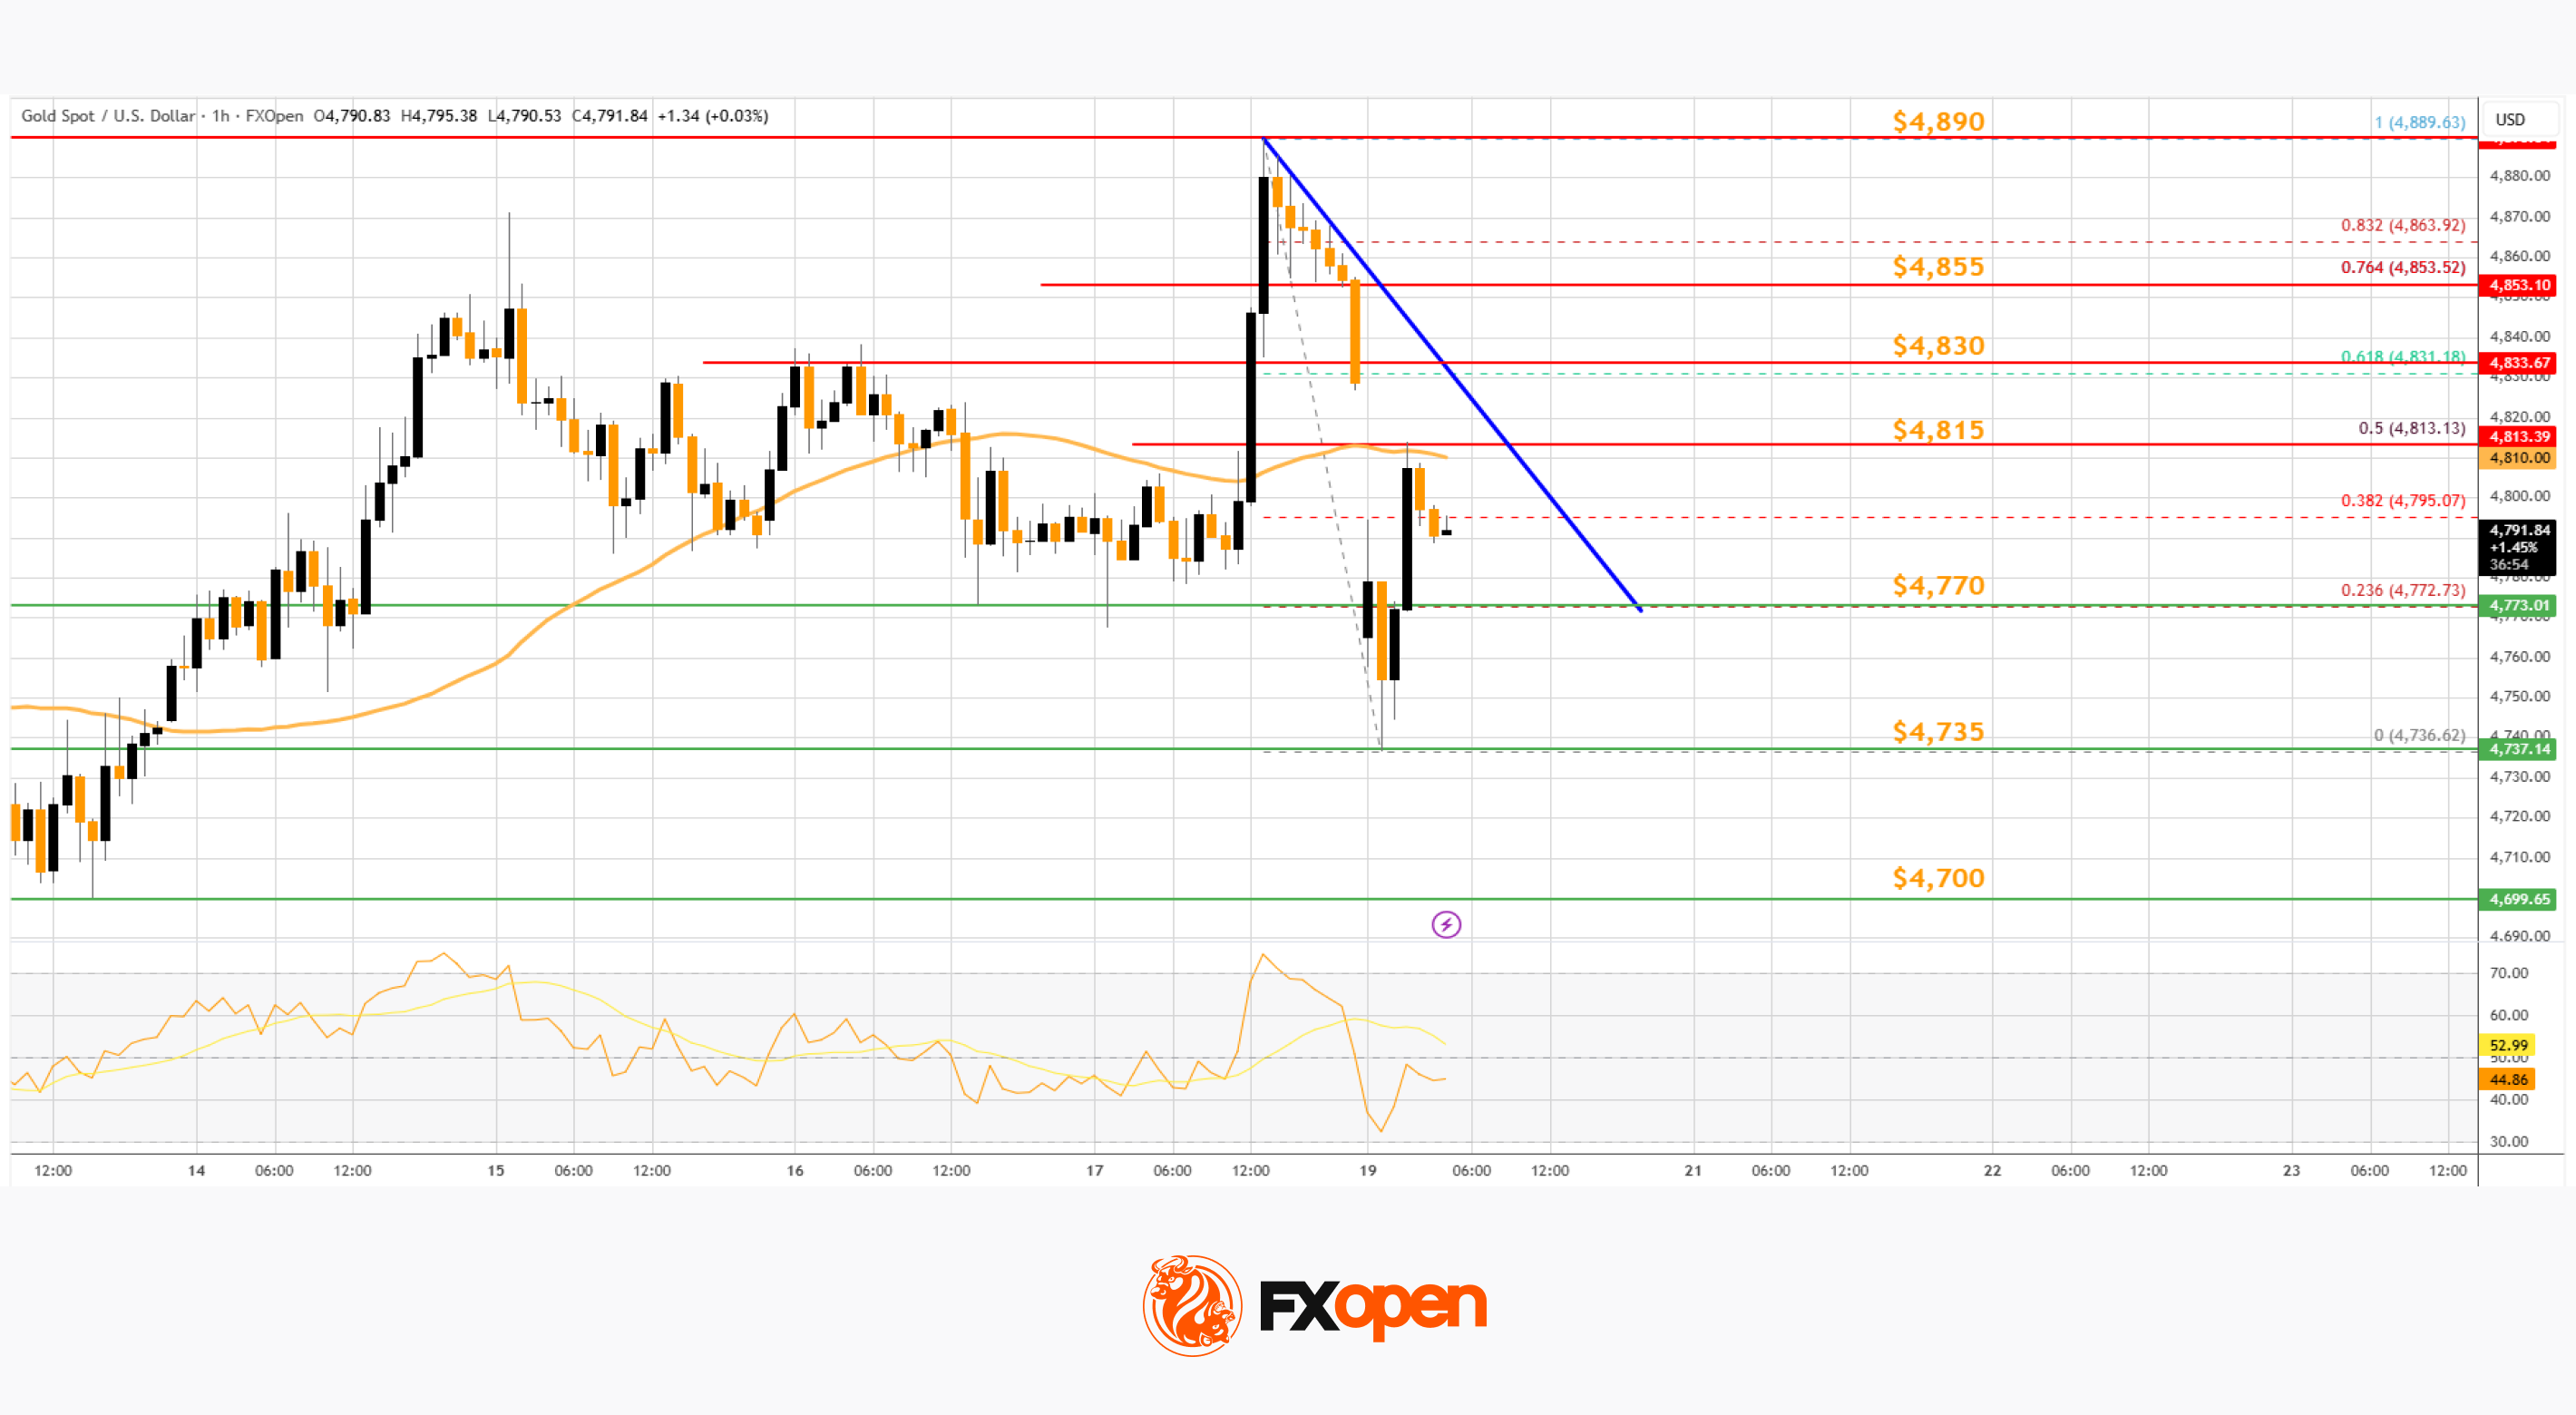
Immediate hurdle on the upside is $4,815 or the 50% Fib retracement level of the downward move from the $4,889 swing high to the $4,699 low. There is also a key bearish trend line forming with resistance at $4,815.
The first major barrier for the bulls could be $4,830 and the 61.8% Fib retracement. A close above $4,830 could initiate a recovery wave to $4,855. An upside break above $4,855 could send Gold price toward $4,890. Any more gains may perhaps set the pace for an increase toward $5,000.
If there is no fresh increase, the price could continue to move down. Initial support on the downside is near the $4,770 level. The first key area of interest might be $4,700. If there is a downside break below $4,700, the price might decline further. In the stated case, the price might drop to $4,500.
On the hourly chart of WTI Crude Oil at FXOpen, the price started a fresh increase from $79.00 against the US Dollar. The price gained bullish momentum after it broke $84.00.
There was a sustained upward movement above $84.50 and $85.00. The bulls pushed the price above the 50-hour simple moving average, and the RSI climbed toward 60. A high was formed near $89.08 before there was a minor pullback. The price declined below the 23.6% Fib retracement level of the upward move from the $78.96 swing low to the $89.08 high.
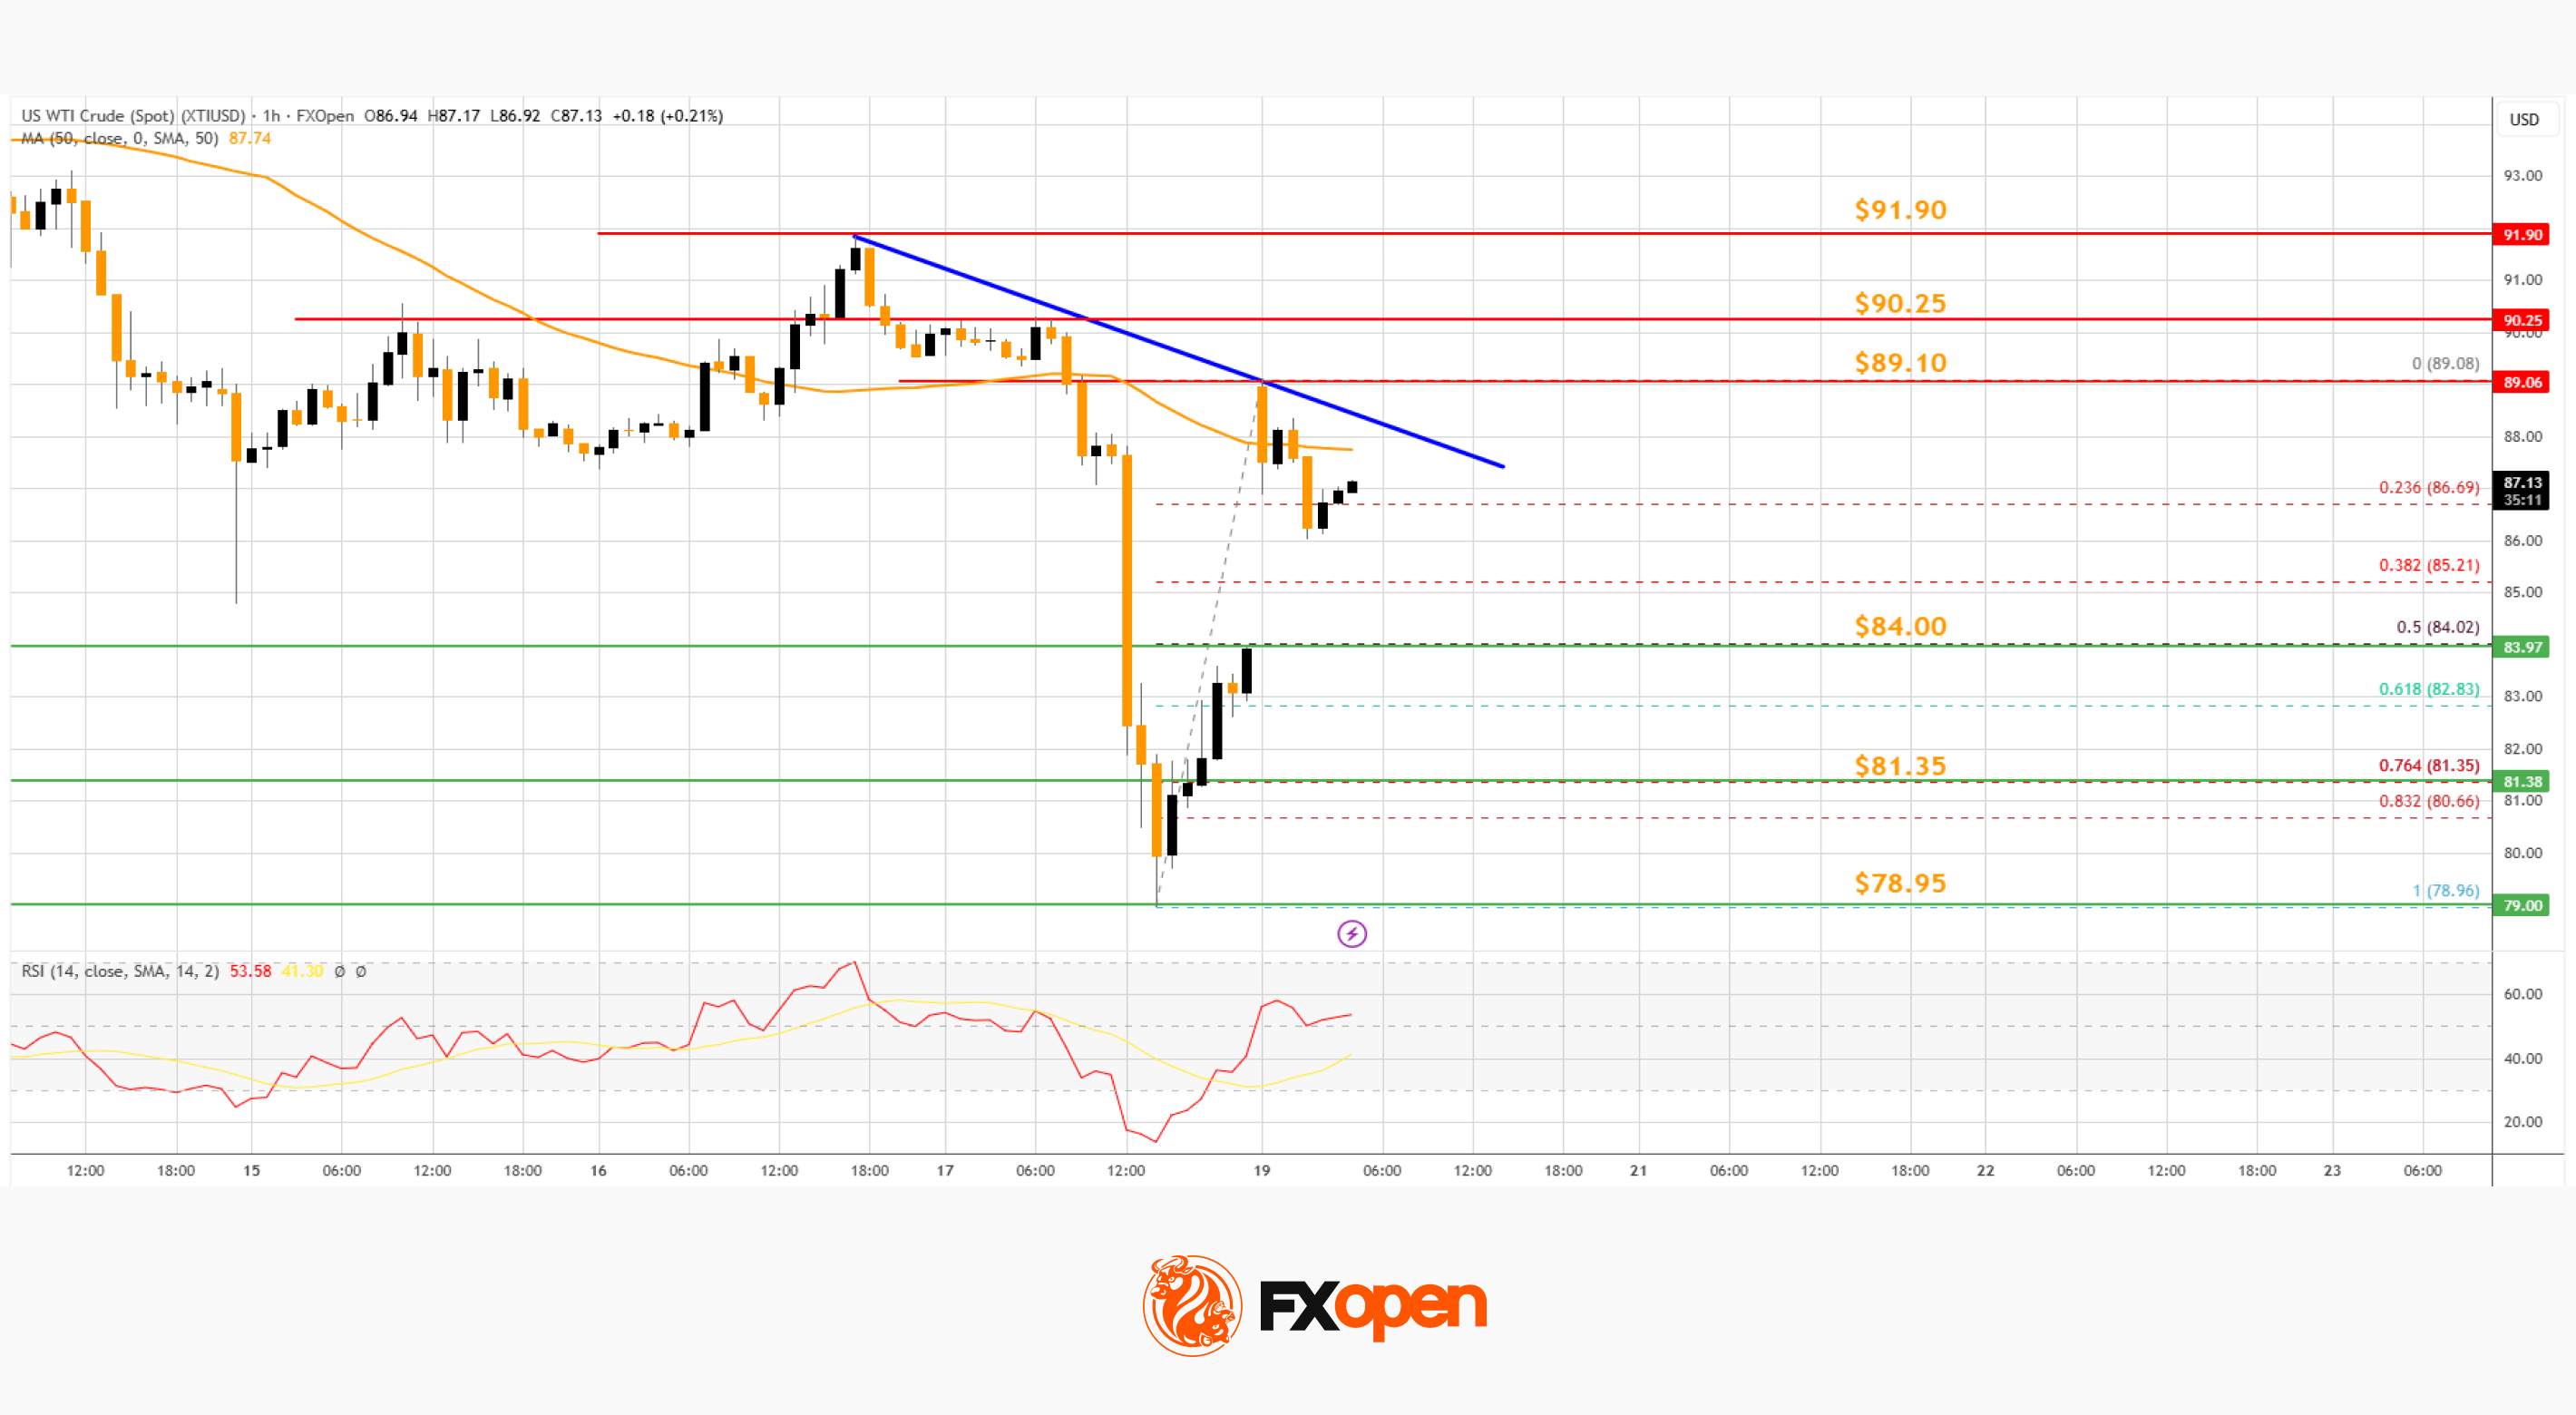
However, the bulls are active above $85.00. Immediate resistance is near a connecting bearish trend line at $89.10. If the price climbs further, it could face hurdles near $90.25.
The next major stop for the bulls might be $91.90. Any more gain might send the price toward $95.00. Conversely, the price might correct gains and test the 50% Fib retracement at $84.00. The next area of interest on the WTI crude oil chart could be $81.35.
If there is a downside break, the price might decline to $80.00. Any more losses may perhaps open the doors for a move toward $75.00.

