
Gold price is consolidating above the $2,565 support zone. Crude oil is showing bearish signs and might decline below $96.50.
· Gold price started a recovery wave from $4,500 against the US Dollar.
· It cleared a key bearish trend line with resistance at $4,620 on the hourly chart of gold at FXOpen.
· Crude oil prices failed to clear the $108 region and started a fresh decline.
· There is a connecting bearish trend line forming with resistance at $100.45 on the hourly chart of XTI/USD at FXOpen.
On the hourly chart of Gold at FXOpen, the price found bids near the $4,500 zone. The price remained in a bullish zone and started a recovery wave above $4,550.
There was a decent move above the 50-hour simple moving average and $4,600. The bulls pushed the price above the 50% Fib retracement level of the downward move from the $4,740 swing high to the $4,510 low.
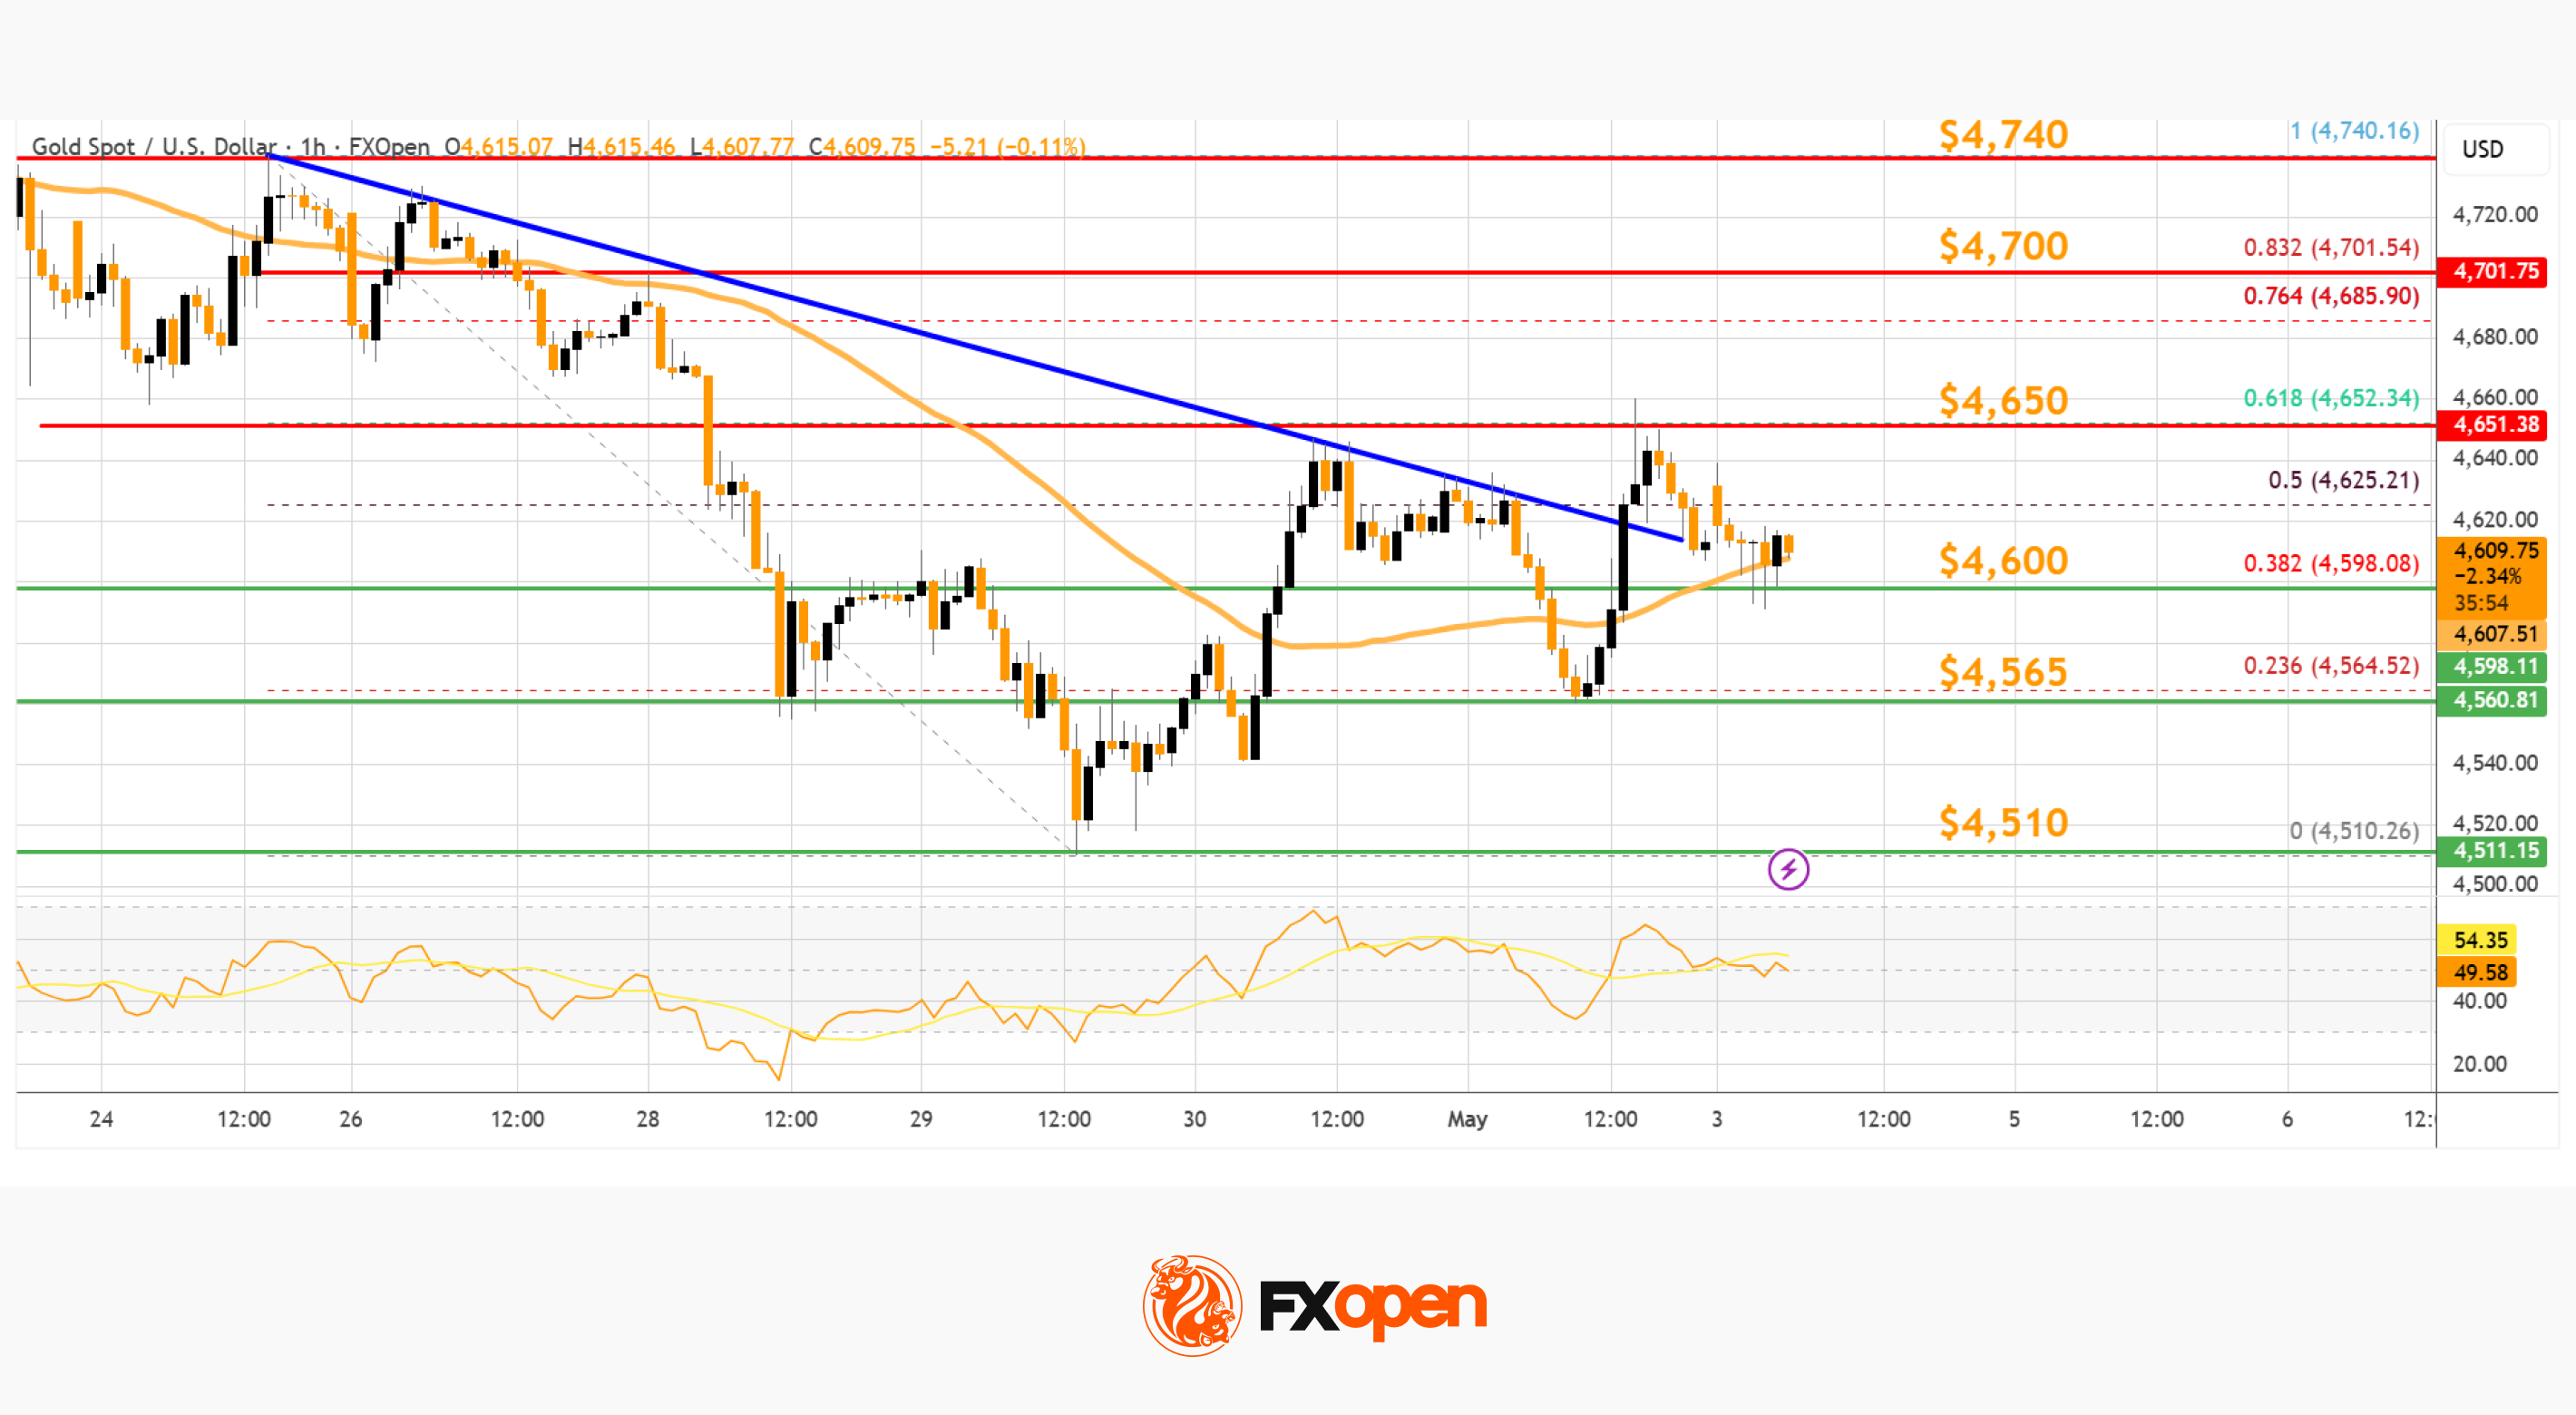
Besides, the price cleared a key bearish trend line with resistance at $4,620. Immediate hurdle is near the 61.8% Fib retracement at $4,650.
The next key breakout level sits at $4,700. An upside break above $4,700 could send Gold price toward $4,740. Any more gains may perhaps set the pace for an increase toward $4,850.
Initial bid zone on the downside could be $4,600. The first major buy zone sits at $4,565. If there is a downside break below $4,565, the price might decline further. In the stated case, the price might drop toward $4,510. Any more losses might push the price toward the $4,420 level.
On the hourly chart of WTI Crude Oil at FXOpen, the price struggled to clear the $108 barrier against the US Dollar. The price started a fresh decline below $105.
The price even dipped below $100 and the 50-hour simple moving average. The bulls are now active near $96.00. A low was formed at $96.04, and the price is now consolidating losses. If there is a fresh increase, it could face sellers near the 23.6% Fib retracement level of the downward move from the $107.62 swing high to the $96.04 low.
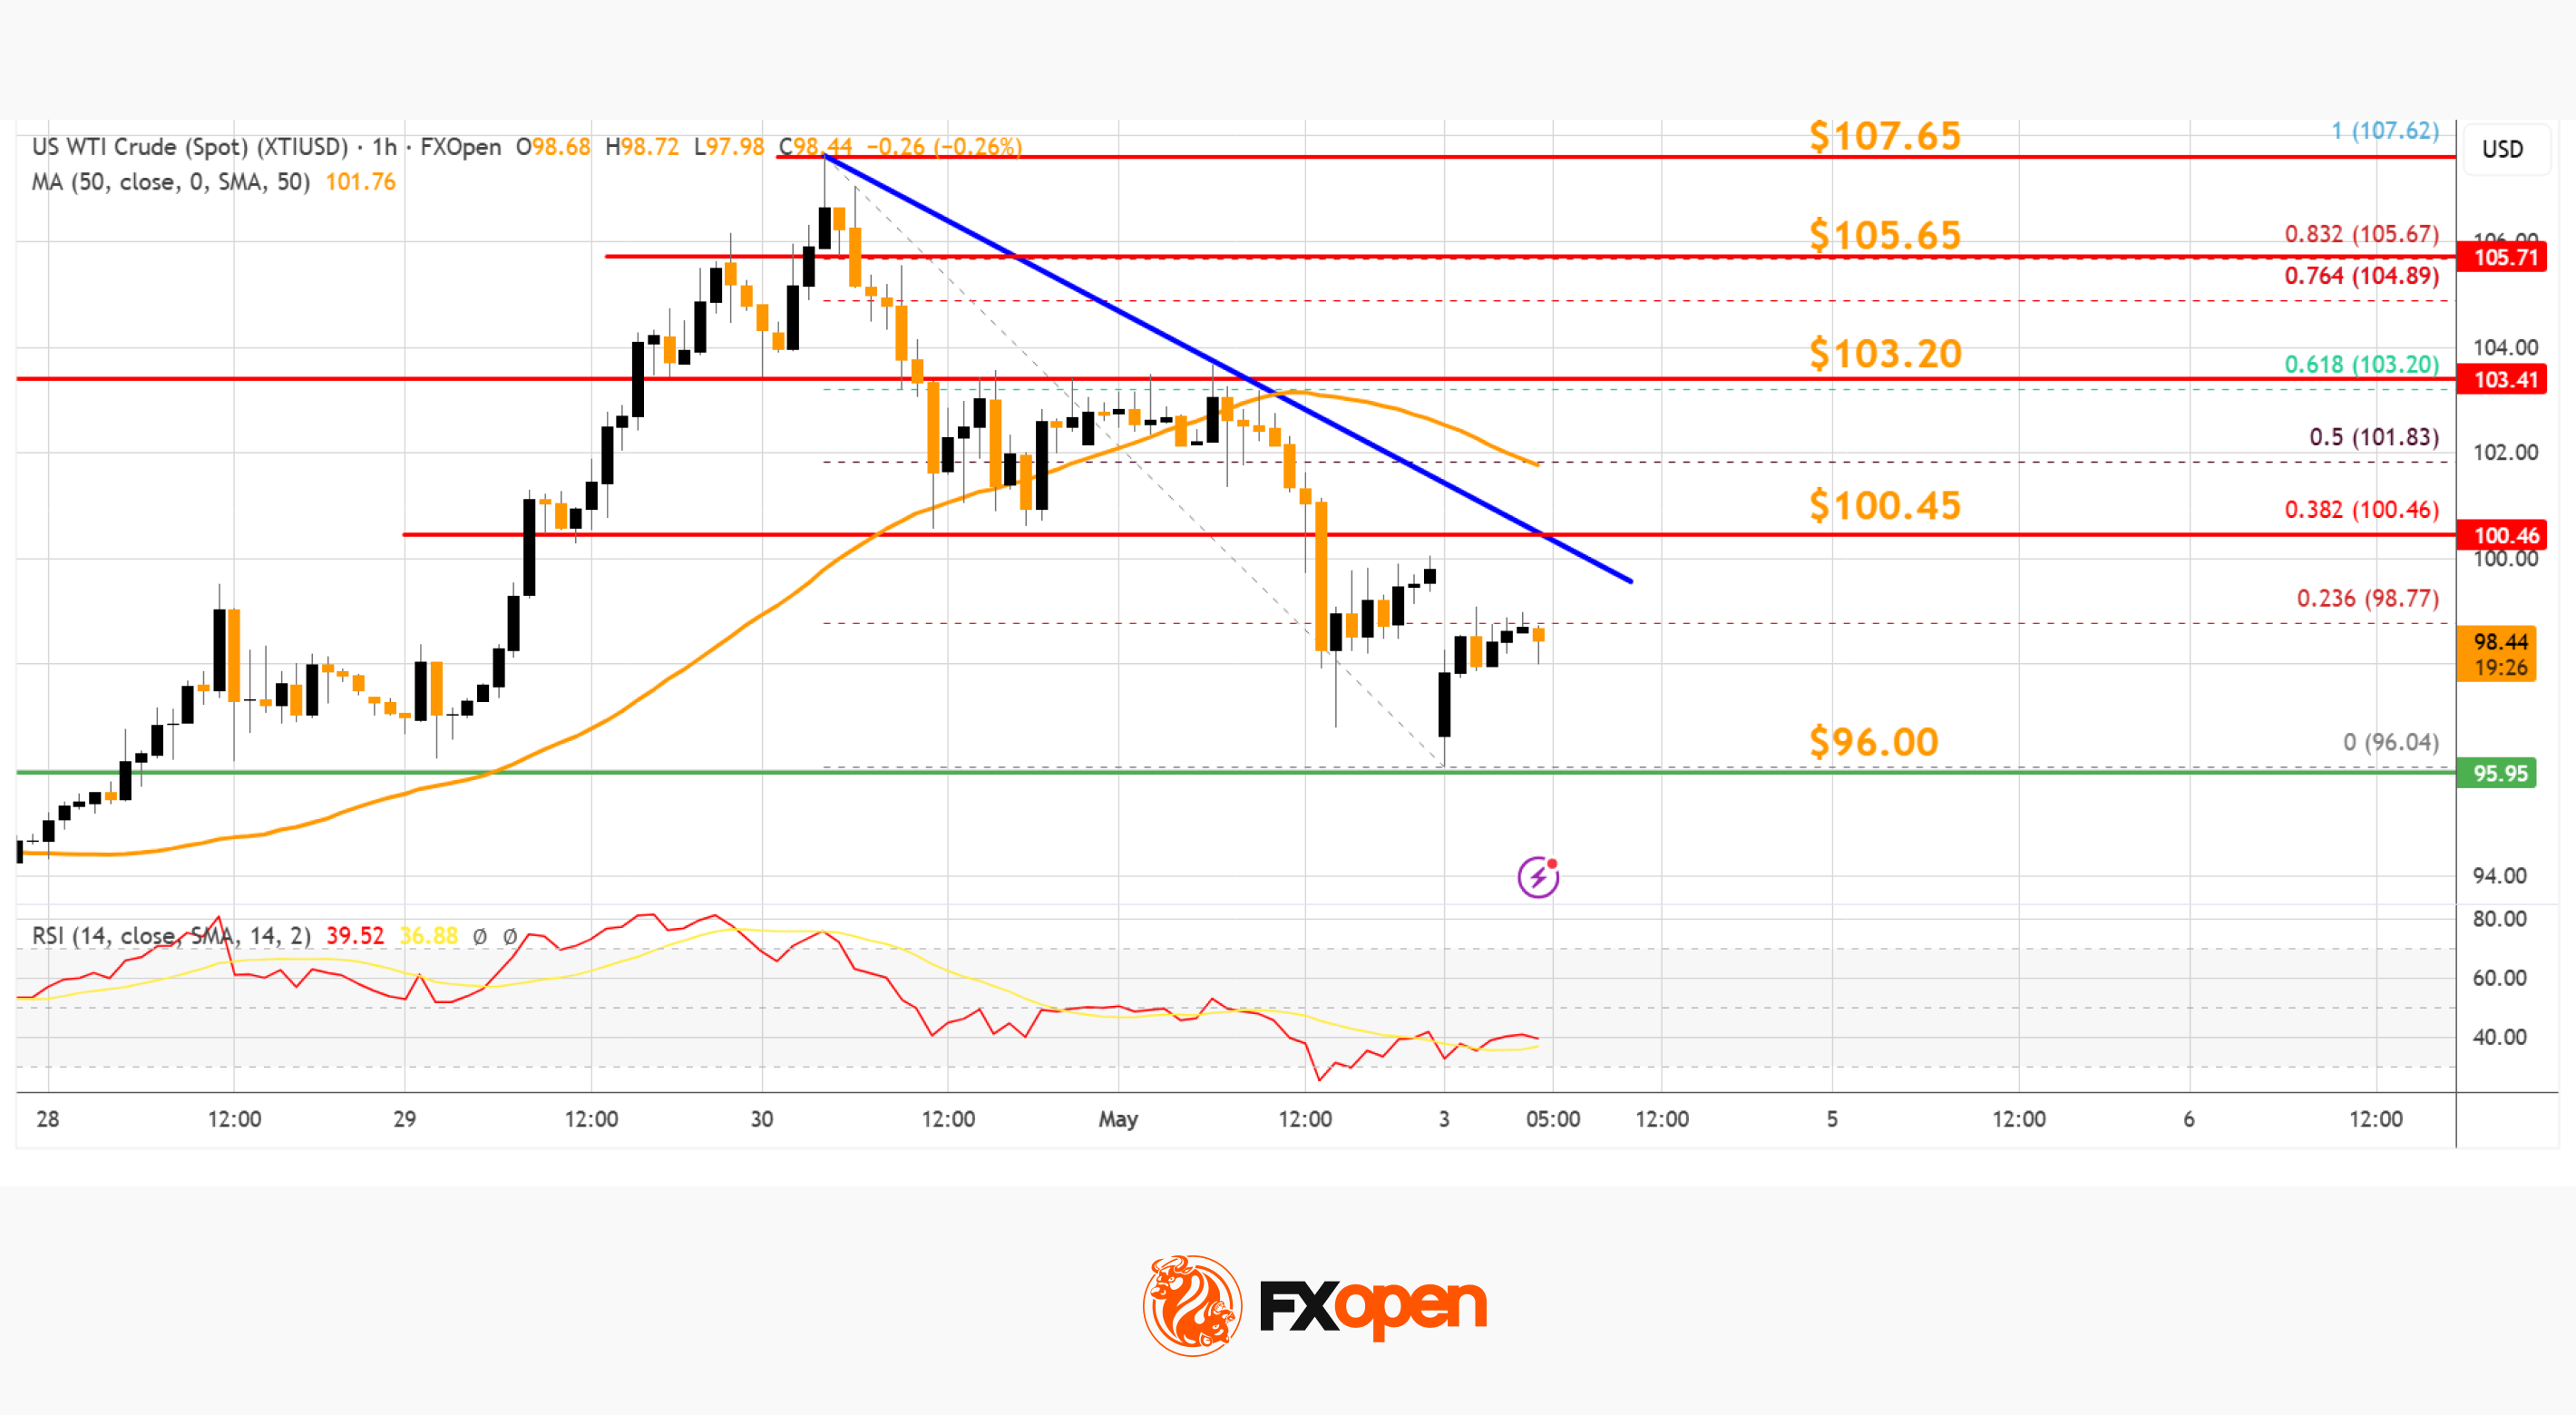
The first major hurdle for the bulls could be near a connecting bearish trend line at $100.45, above which the price could rise and test the 61.8% Fib retracement level at $103.20.
Any more gains might send the price toward $105.65. The main breakout zone sits at $108. Conversely, the price might continue to move down and revisit $96.00. The next major pivot zone on the WTI crude oil chart is $92.00.
If there is a downside break, the price might decline toward $90.00. Any more losses may perhaps open the doors for a move toward the $86.50 support zone.

