
Gold price rallied above $4,750 before correcting lower. Crude oil prices are rising and could climb further higher toward $110.00.
· Gold price gained pace for a move toward $4,800 and recently corrected lower against the US Dollar.
· A key bullish trend line is forming with support at $4,630 on the hourly chart of gold at FXOpen.
· WTI Crude oil prices are moving higher above the $100.00 resistance zone.
· There was a break above a bearish trend line with resistance at $97.00 on the hourly chart of XTI/USD at FXOpen.
On the hourly chart of Gold at FXOpen, the price was able to climb above $4,500. The price even surpassed $4,750 before the bears appeared.
The price traded close to $4,800 before there was a downside correction. There was a move below $4,750 and $4,700. The price settled below the 50-hour simple moving average, and RSI dipped below 50. There was a move below the 38.2% Fib retracement level of the upward move from the $4,351 swing low to the $4,800 high.
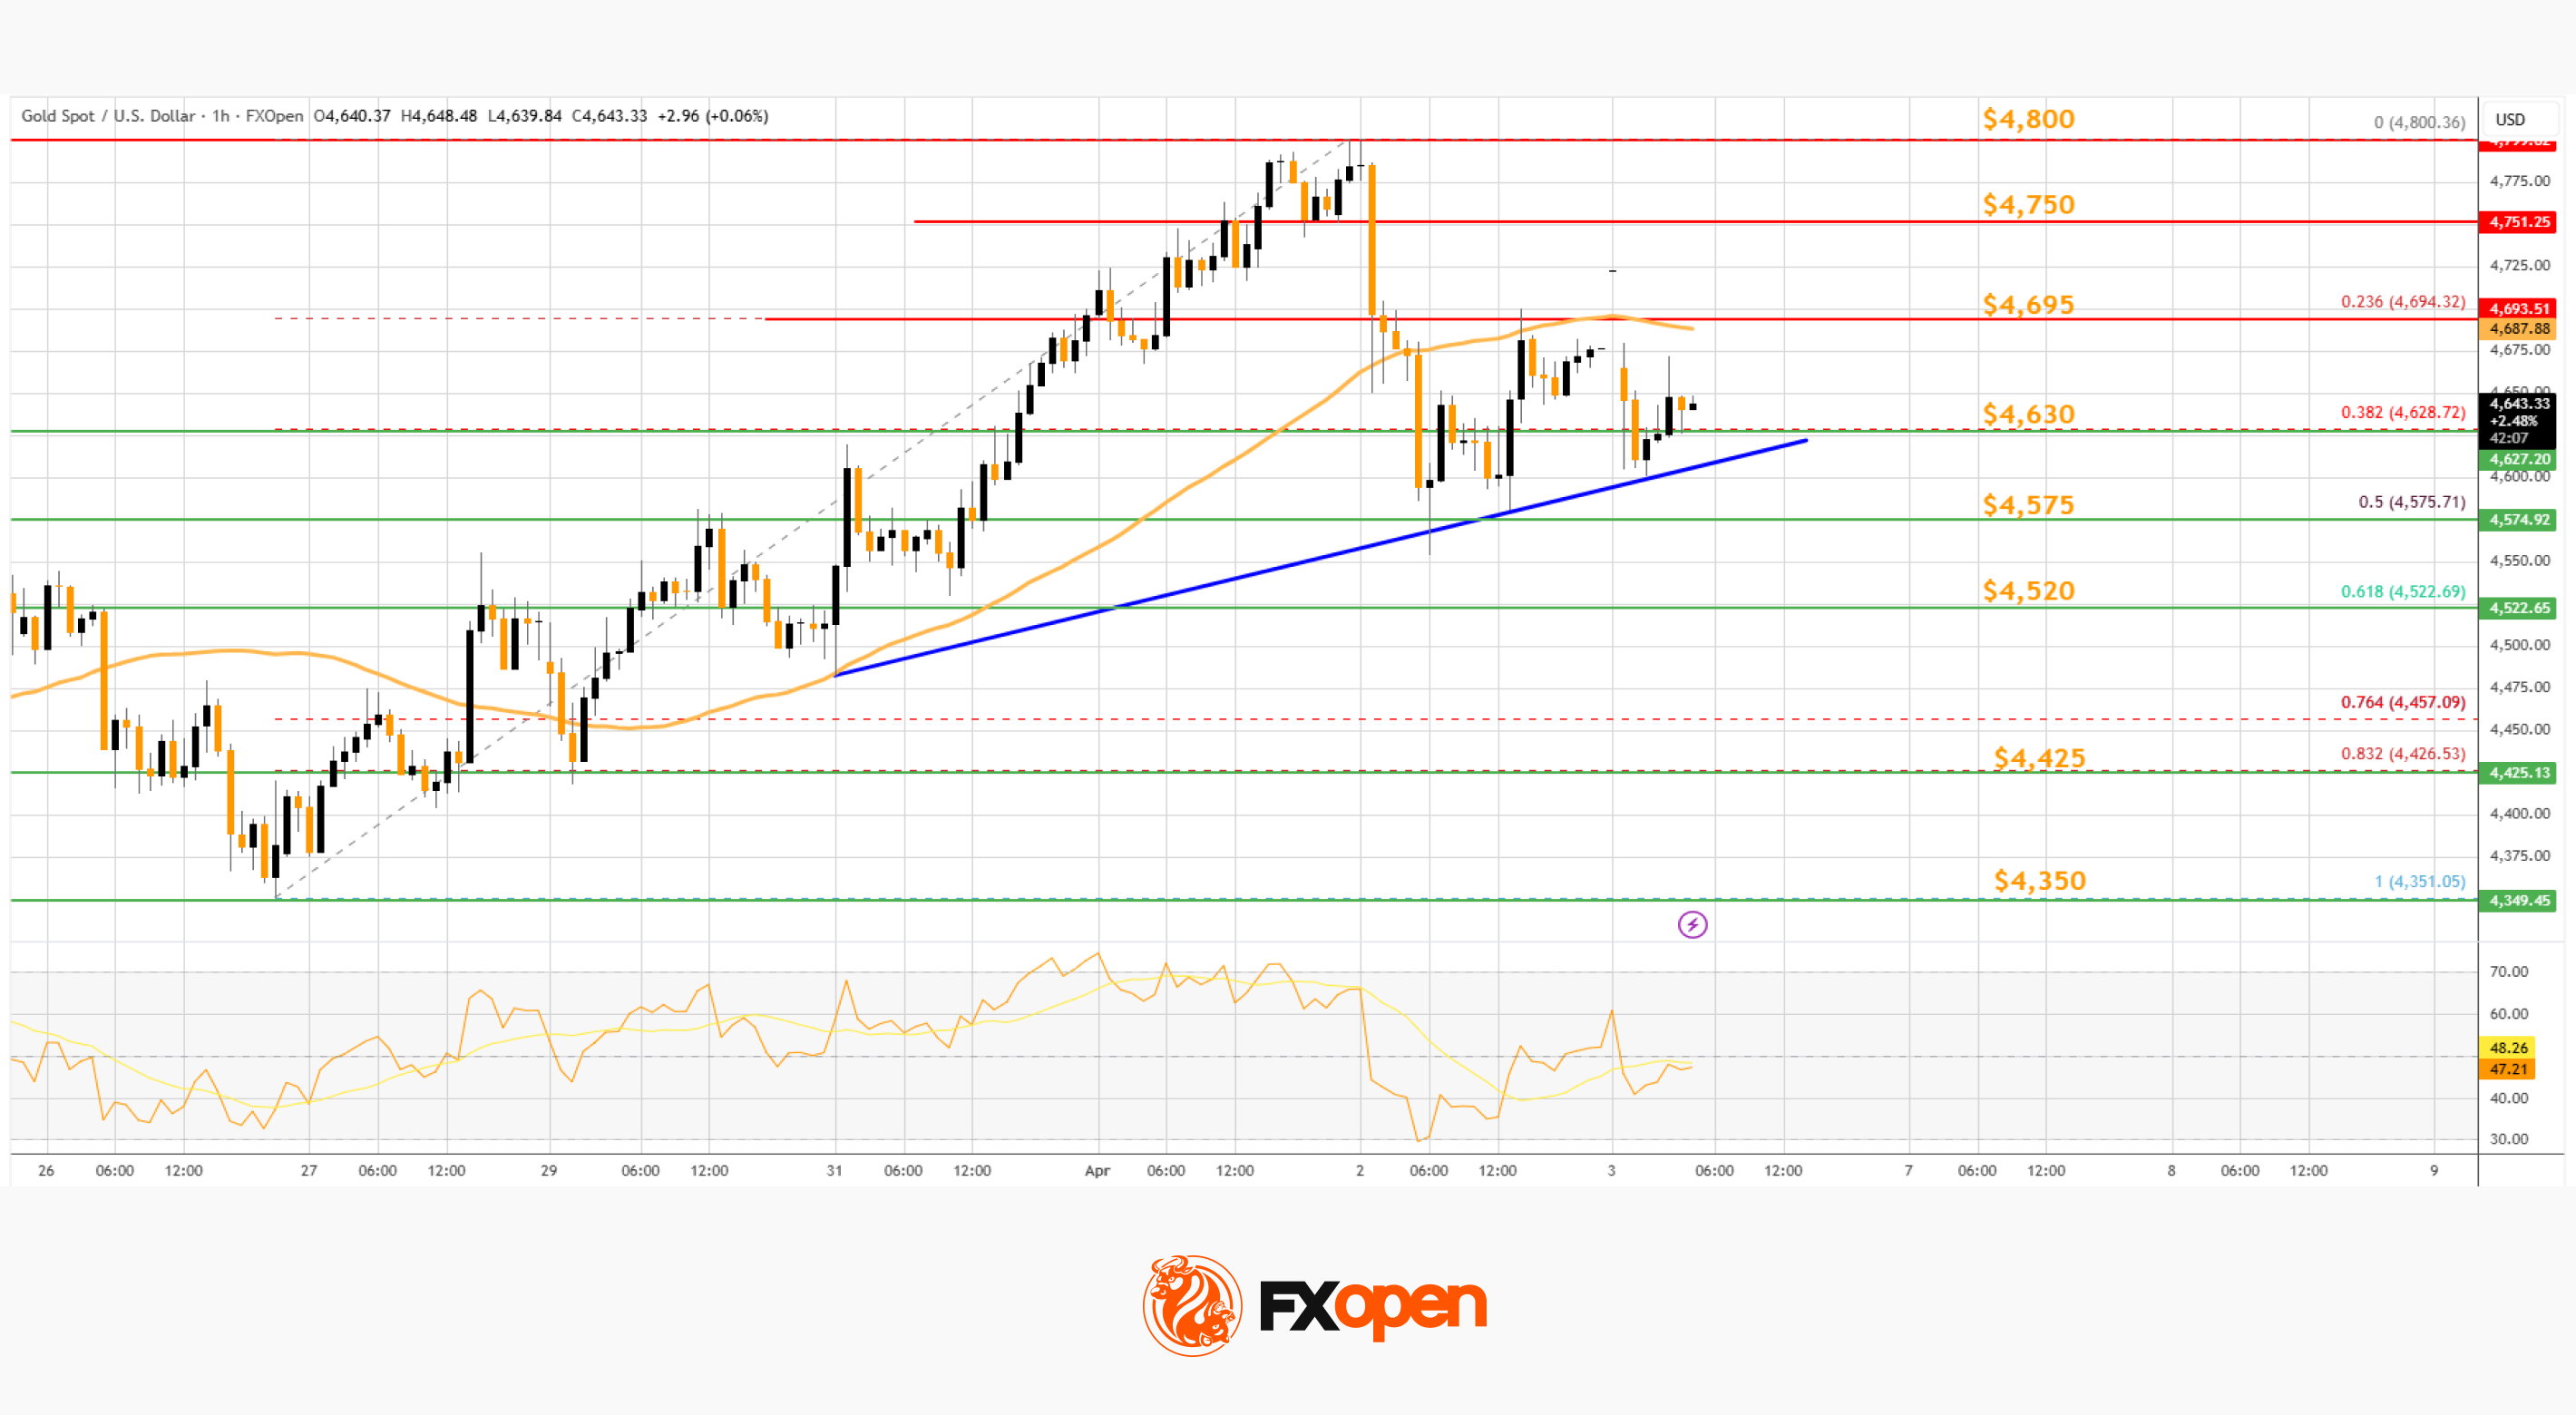
However, the bulls are active above $4,575 and the 50% Fib retracement. There is also a key bullish trend line forming with support at $4,630.
Immediate hurdle on the upside is $4,695 and the 50-hour simple moving average. The next major breakout level is $4,750. An upside break above $4,750 could send Gold price toward $4,800. Any more gains may perhaps set the pace for an increase toward $4,880.
If there is no fresh increase, the price could continue to move down. Initial support on the downside is near $4,630 and the trend line. The first key breakdown zone could be $4,520. If there is a downside break below $4,520, the price might decline further. In the stated case, the price might drop to $4,350.
On the hourly chart of WTI Crude Oil at FXOpen, the price started a steady increase against the US Dollar. The price gained bullish momentum after it settled above $96.40.
The bulls pushed the price above the 50-hour simple moving average, and the RSI climbed toward 75. Besides, there was a break above a bearish trend line with resistance at $97.00. The price tested the $105.85 zone and is currently consolidating gains.
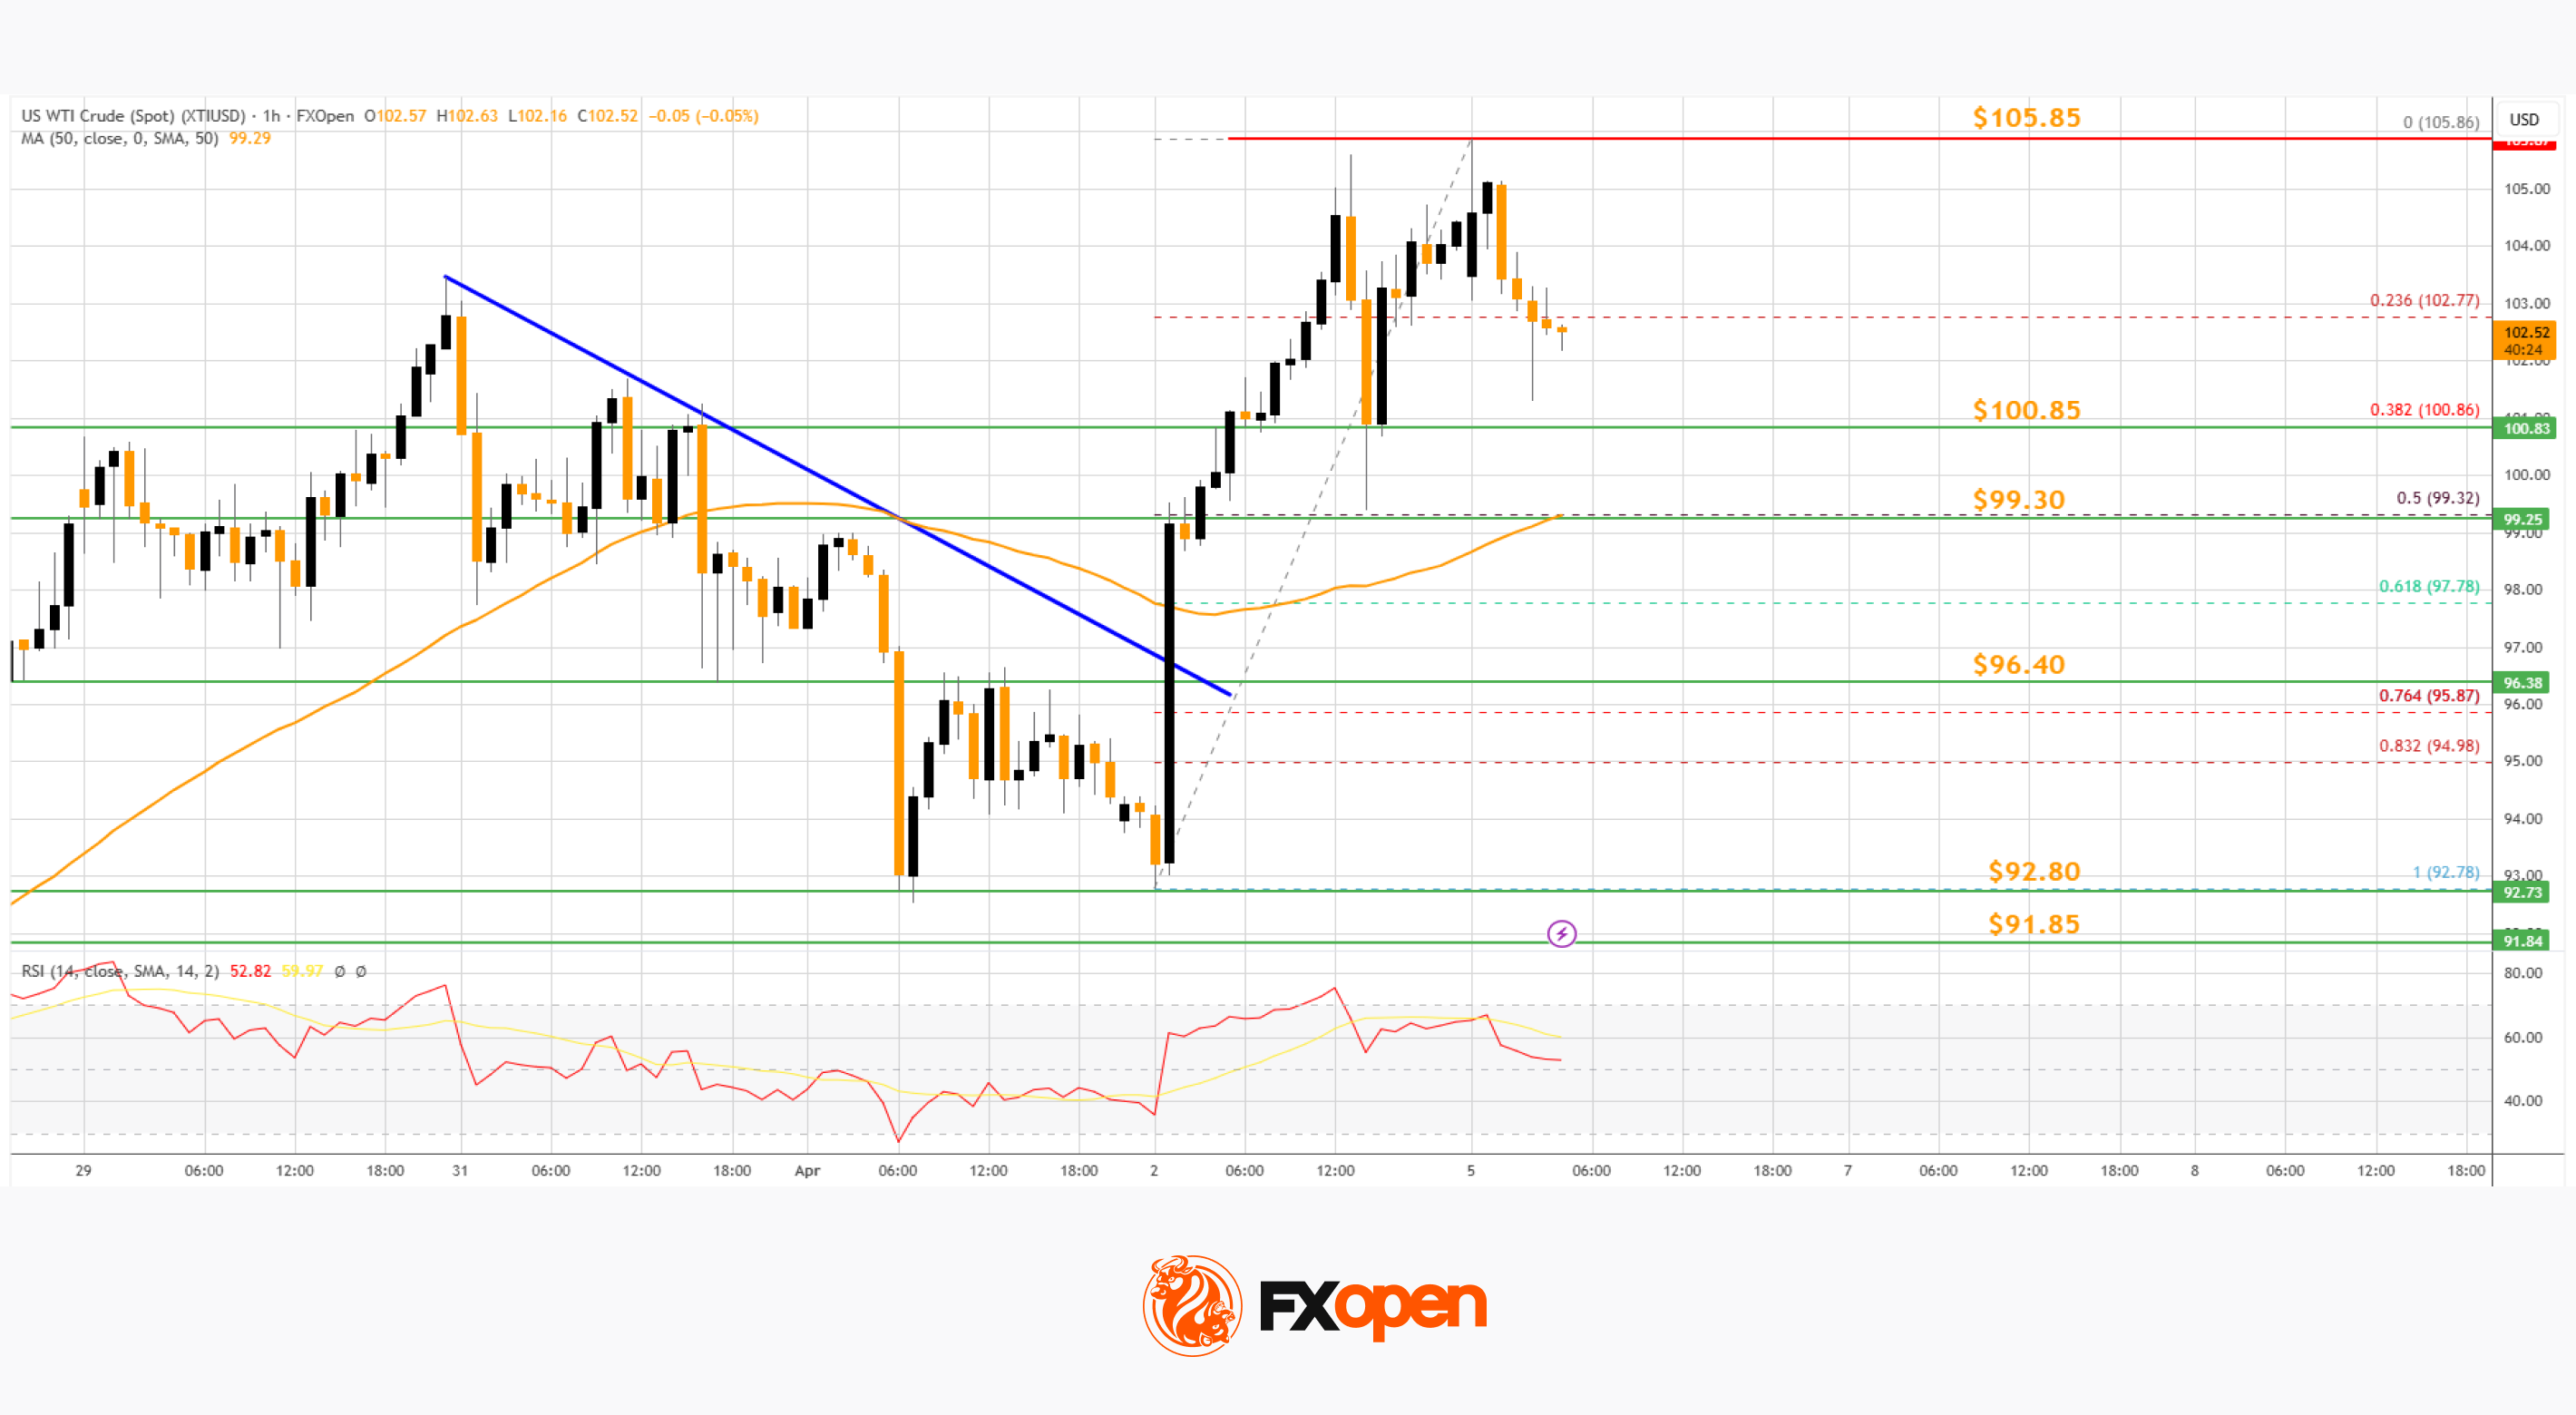
There was a minor pullback below $103 and the 23.6% Fib retracement level of the upward move from the $92.78 swing low to the $105.86 low.
If there is a fresh increase, the price could struggle near $105.85. A close above $106.85 could send the price toward $108. The next key area of interest might be $110. Any more gains might send the price toward $112.
Conversely, the price might correct gains and test $100.85. The main bid area on the WTI crude oil chart could be $99.30, the 50% Fib retracement level, and the 50-hour simple moving average. If there is a downside break, the price might decline toward $96.40. Any more losses may perhaps open the doors for a move to $92.80.

