
Gold price rallied to a new all-time high above $3,670. Crude oil is showing bearish signs and might decline below $62.25.
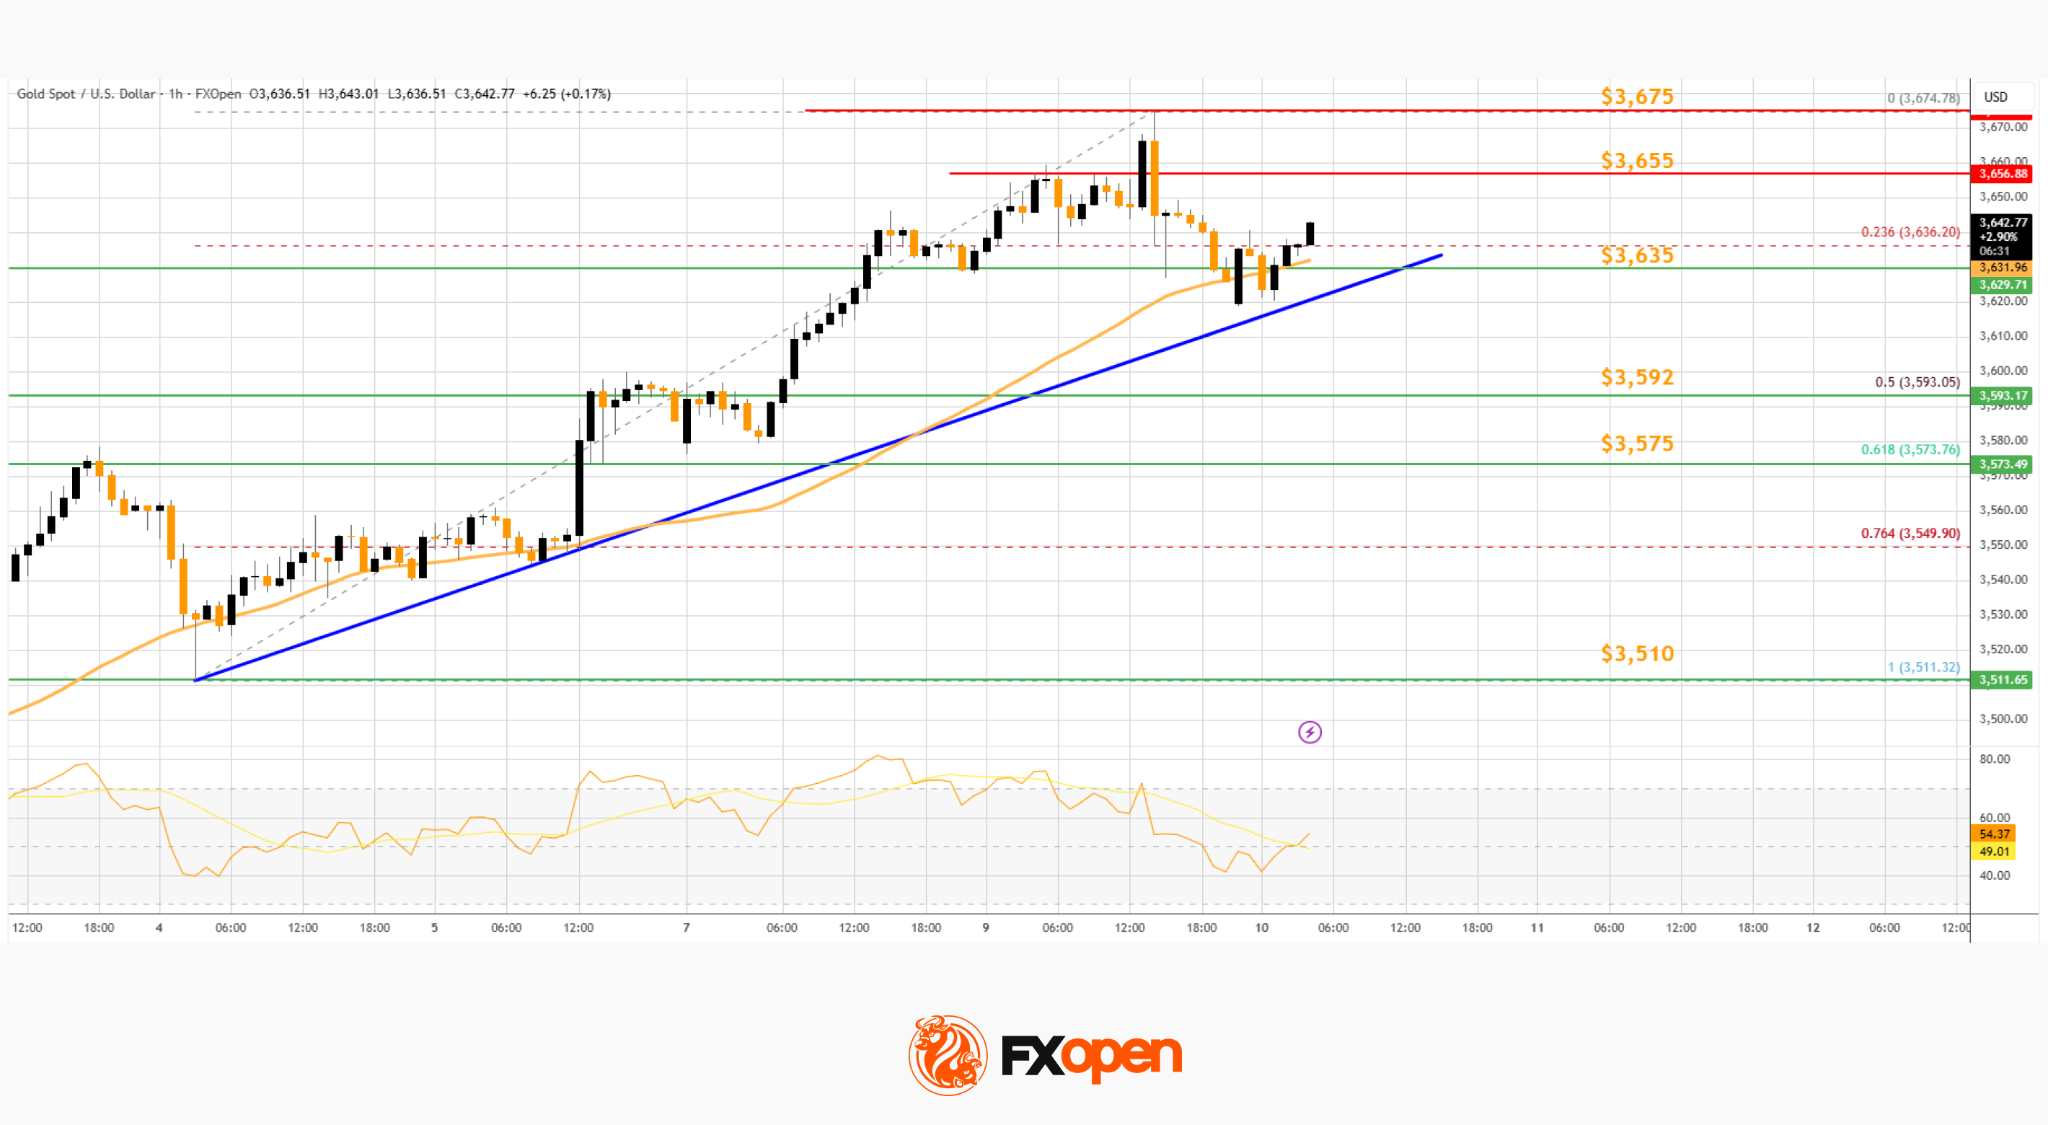
On the hourly chart of Gold at FXOpen, the price formed a base above $3,500. The price remained in a bullish zone and started a strong increase above $3,550.
There was a decent move above the 50-hour simple moving average and $3,620. The bulls pushed the price above the $3,640 and $3,650 resistance levels. Finally, the price climbed to a new all-time high at $3,674 before there was a pullback.
The price dipped below the 23.6% Fib retracement level of the upward move from the $3,511 swing low to the $3,674 high, and the RSI declined below 50. Initial support on the downside is near $3,635 and the 50-hour simple moving average.
There is also a key bullish trend line forming with support at $3,635. The first major support is near the 50% Fib retracement at $3,592. If there is a downside break below $3,592, the price might decline further. In the stated case, the price might drop toward $3,575. Any more losses might push the price toward $3,510.
Immediate resistance is near $3,655. The next major hurdle for the bulls is $3,675. An upside break above $3,675 could send Gold price toward $3,688. Any more gains may perhaps set the pace for an increase toward $3,700.
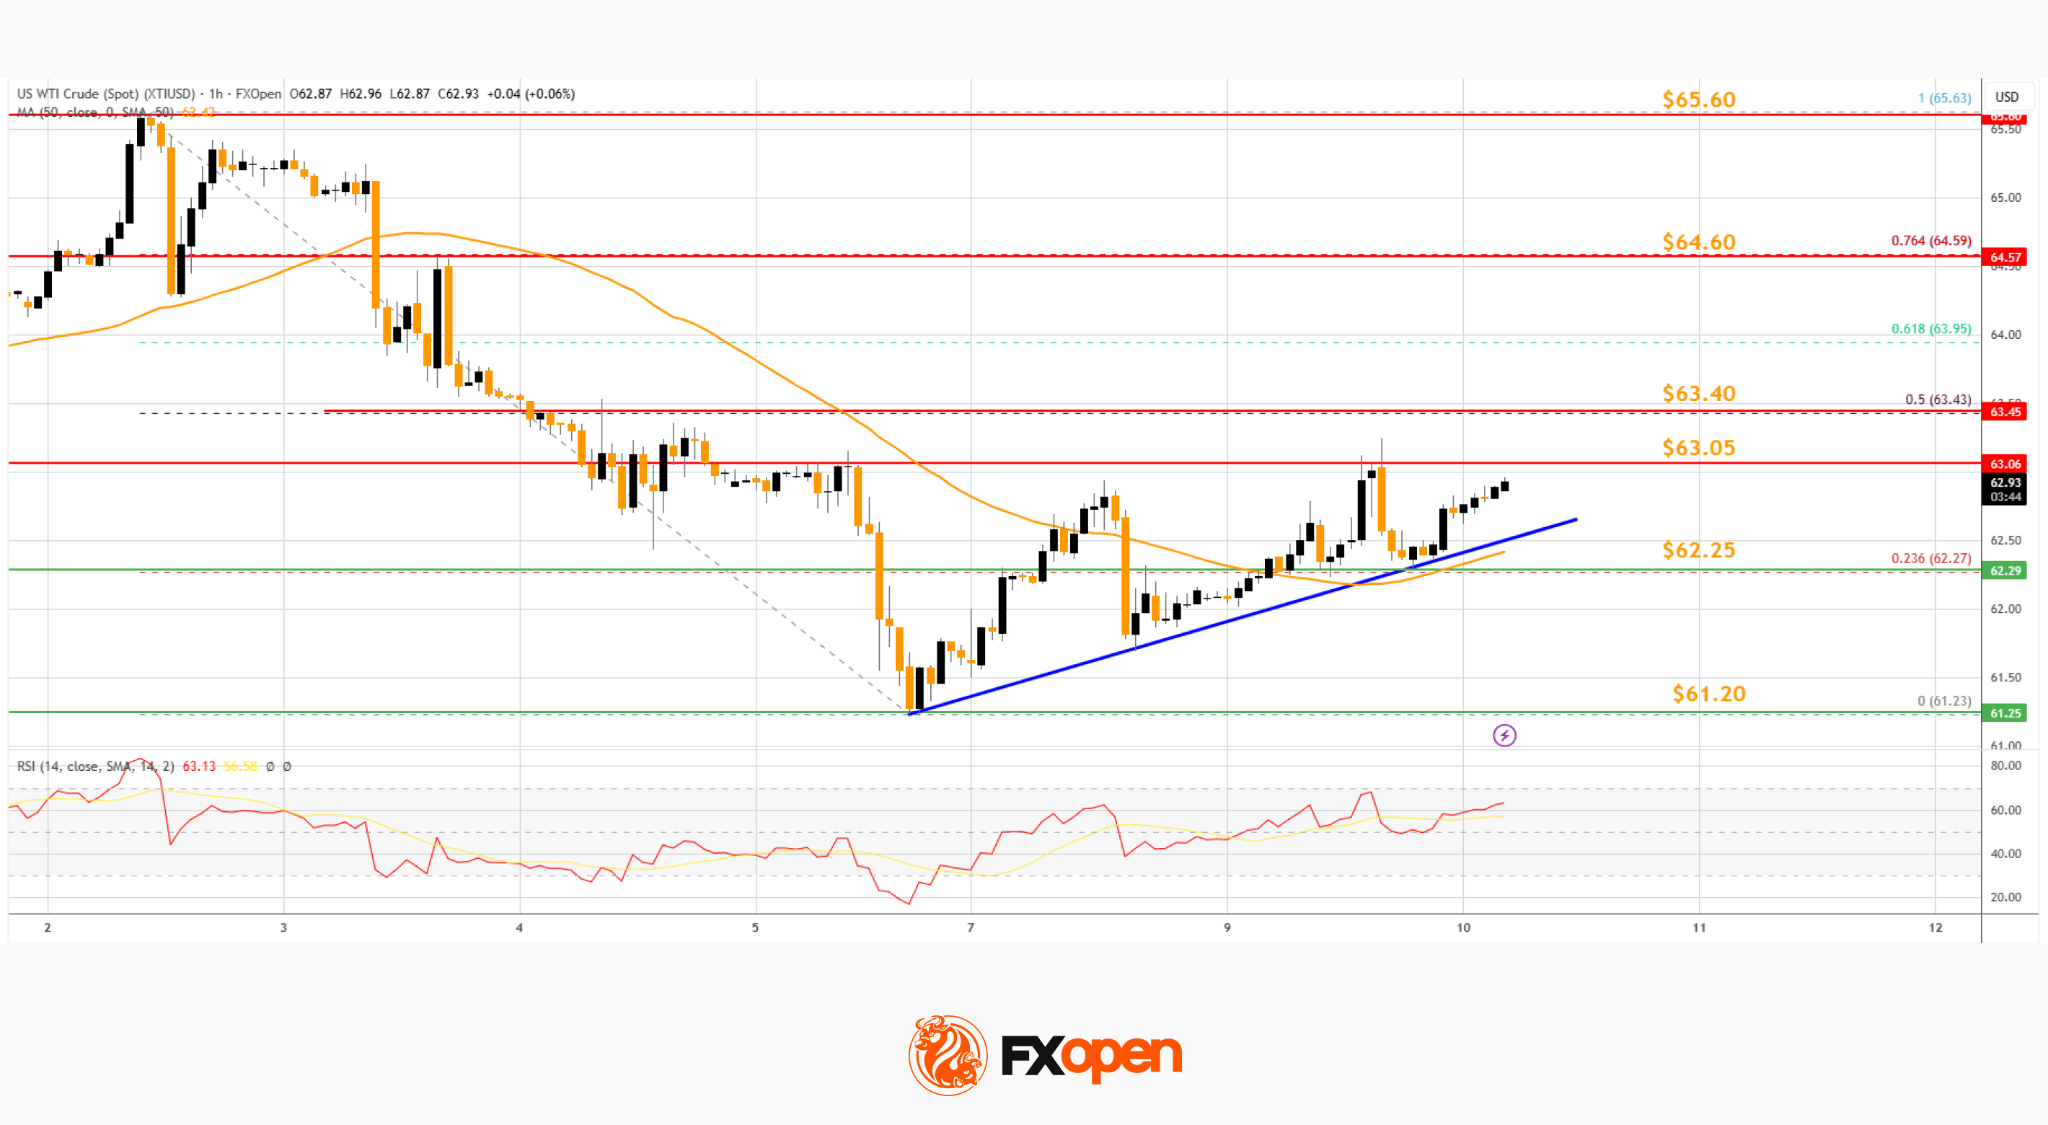
On the hourly chart of WTI Crude Oil at FXOpen, the price struggled to clear $65.60 against the US Dollar. The price started a fresh decline below $64.60.
The bears gained strength and pushed the price below $62.00. Finally, the price tested $61.20 and recently started a recovery wave. There was a move above $62.00, the 50-hour simple moving average, and the 23.6% Fib retracement level of the downward move from the $65.63 swing high to the $61.23 low.
The bears are now active near $63.00. If there is a fresh increase, the price could face a barrier near $63.05. The first major resistance is near the 50% Fib retracement at $63.40. The next stop for the bulls could be near $64.60. Any more gains might send the price toward $65.60.
Conversely, the price might start another decline and test a short-term bullish trend line with support at $62.25 and the 50-hour simple moving average.
The next major support on the WTI crude oil chart is $61.20. If there is a downside break, the price might decline toward $60.50. Any more losses may perhaps open the doors for a move toward $60.00.

