
Gold price started a downside correction from $5,115. WTI Crude oil is now attempting to recover after sliding toward $61.80.
· Gold price climbed higher toward the $5,120 zone before there was a sharp decline against the US Dollar.
· A key bearish trend line is forming with resistance at $4,945 on the hourly chart of gold at FXOpen.
· WTI Crude oil prices extended losses below the $63.40 pivot zone.
· It dipped below a rising channel with support at $62.85 on the hourly chart of XTI/USD at FXOpen.
On the hourly chart of Gold at FXOpen, the price climbed above $5,000. The price even spiked above $5,100 before the bears appeared.
A high was formed near $5,115 before there was a fresh decline. The last swing high was near $5,052 before the price settled below $5,000 and the 50-hour simple moving average. It tested the $4,850 zone.
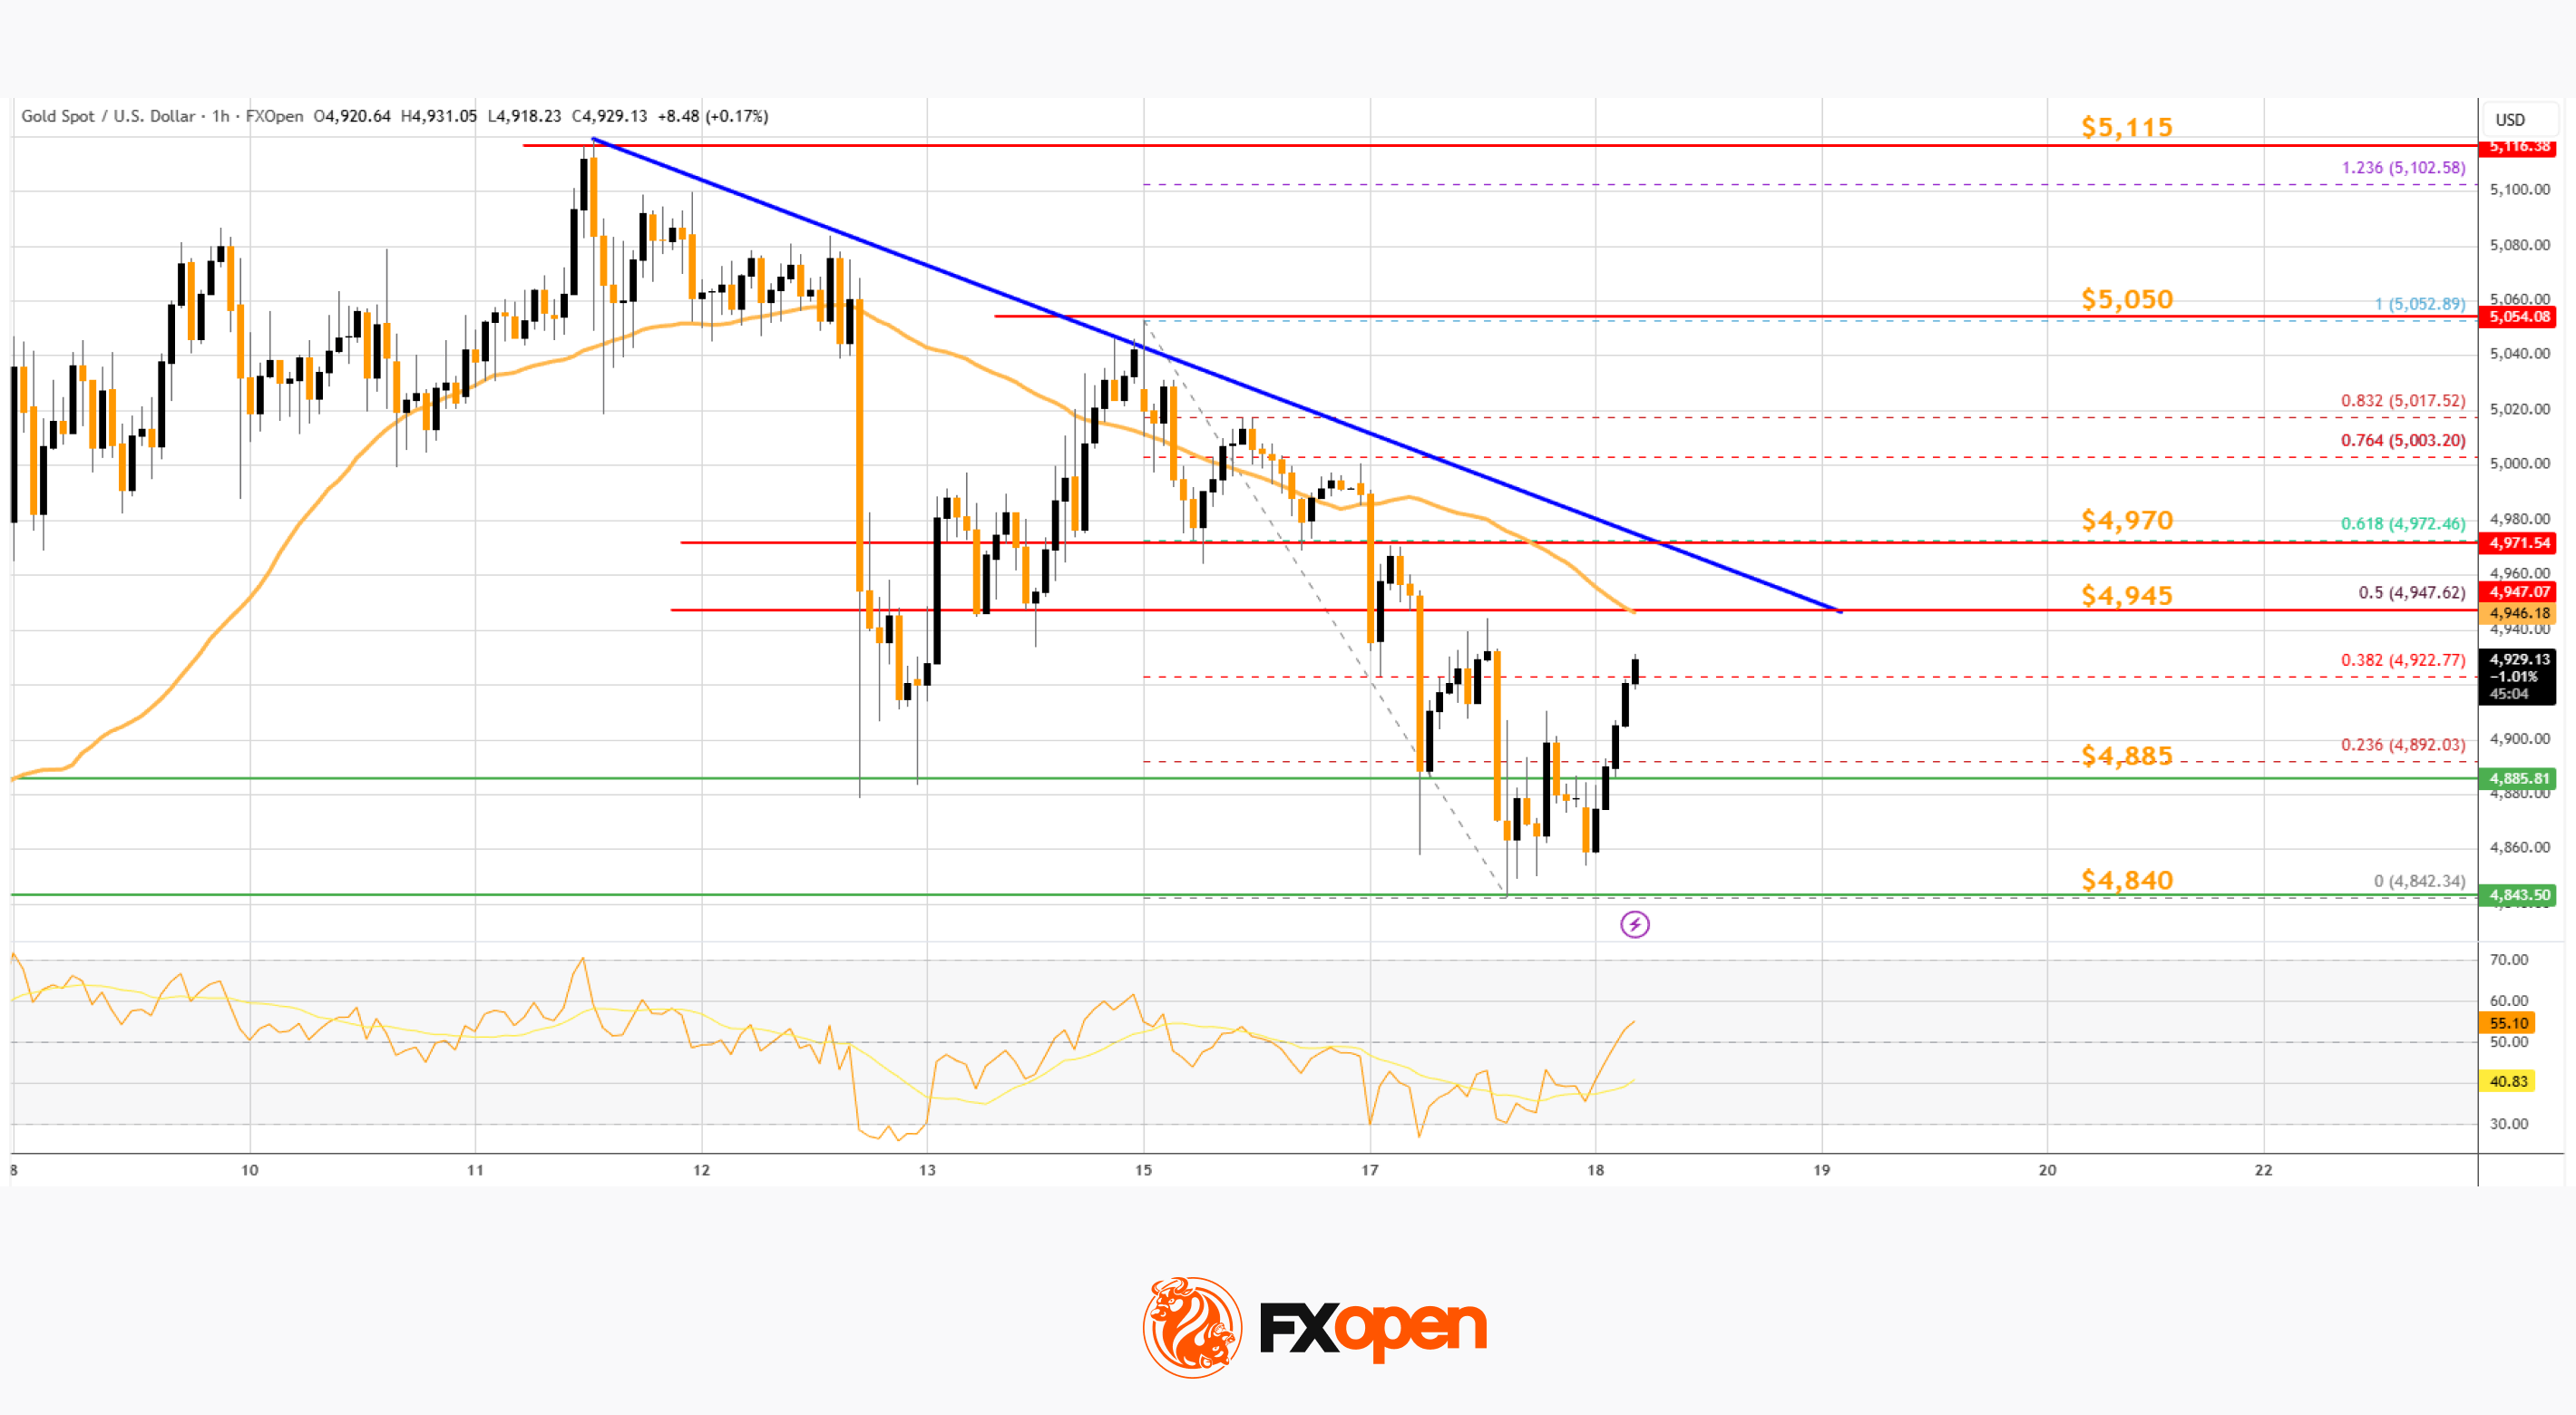
A low is formed near $4,842, and the price is now correcting losses. There was a minor move above the 23.6% Fib retracement level of the downward move from the $5,052 swing high to the $4,842 low.
Immediate barrier on the upside is $4,945, the 50-hour simple moving average, and the 50% Fib retracement. There is also a bearish trend line with resistance at $4,945. The first major hurdle for the bulls could be $4,970.
A close above $4,970 could send the price above $5,000. The next sell zone sits at $5,050, above which the price could test the $5,115 region. Any more gains might call for a move toward $5,200.
An upside break above $5,200 could send Gold price toward $5,285. Initial support on the downside is $4,885. The next key level is $4,840. If there is a downside break below $4,840, the price might decline further. In the stated case, the price might drop toward $4,750.
On the hourly chart of WTI Crude Oil at FXOpen, the price struggled to continue higher above $65.00 against the US Dollar. The price formed a short-term top and started a fresh decline below $64.20.
There was a steady drop below the $63.40 pivot level. The bears even pushed the price below $62.50, a rising channel, and the 50-hour simple moving average. Finally, the price tested $61.80. The recent swing low was formed near $61.80, and the price is now correcting losses.
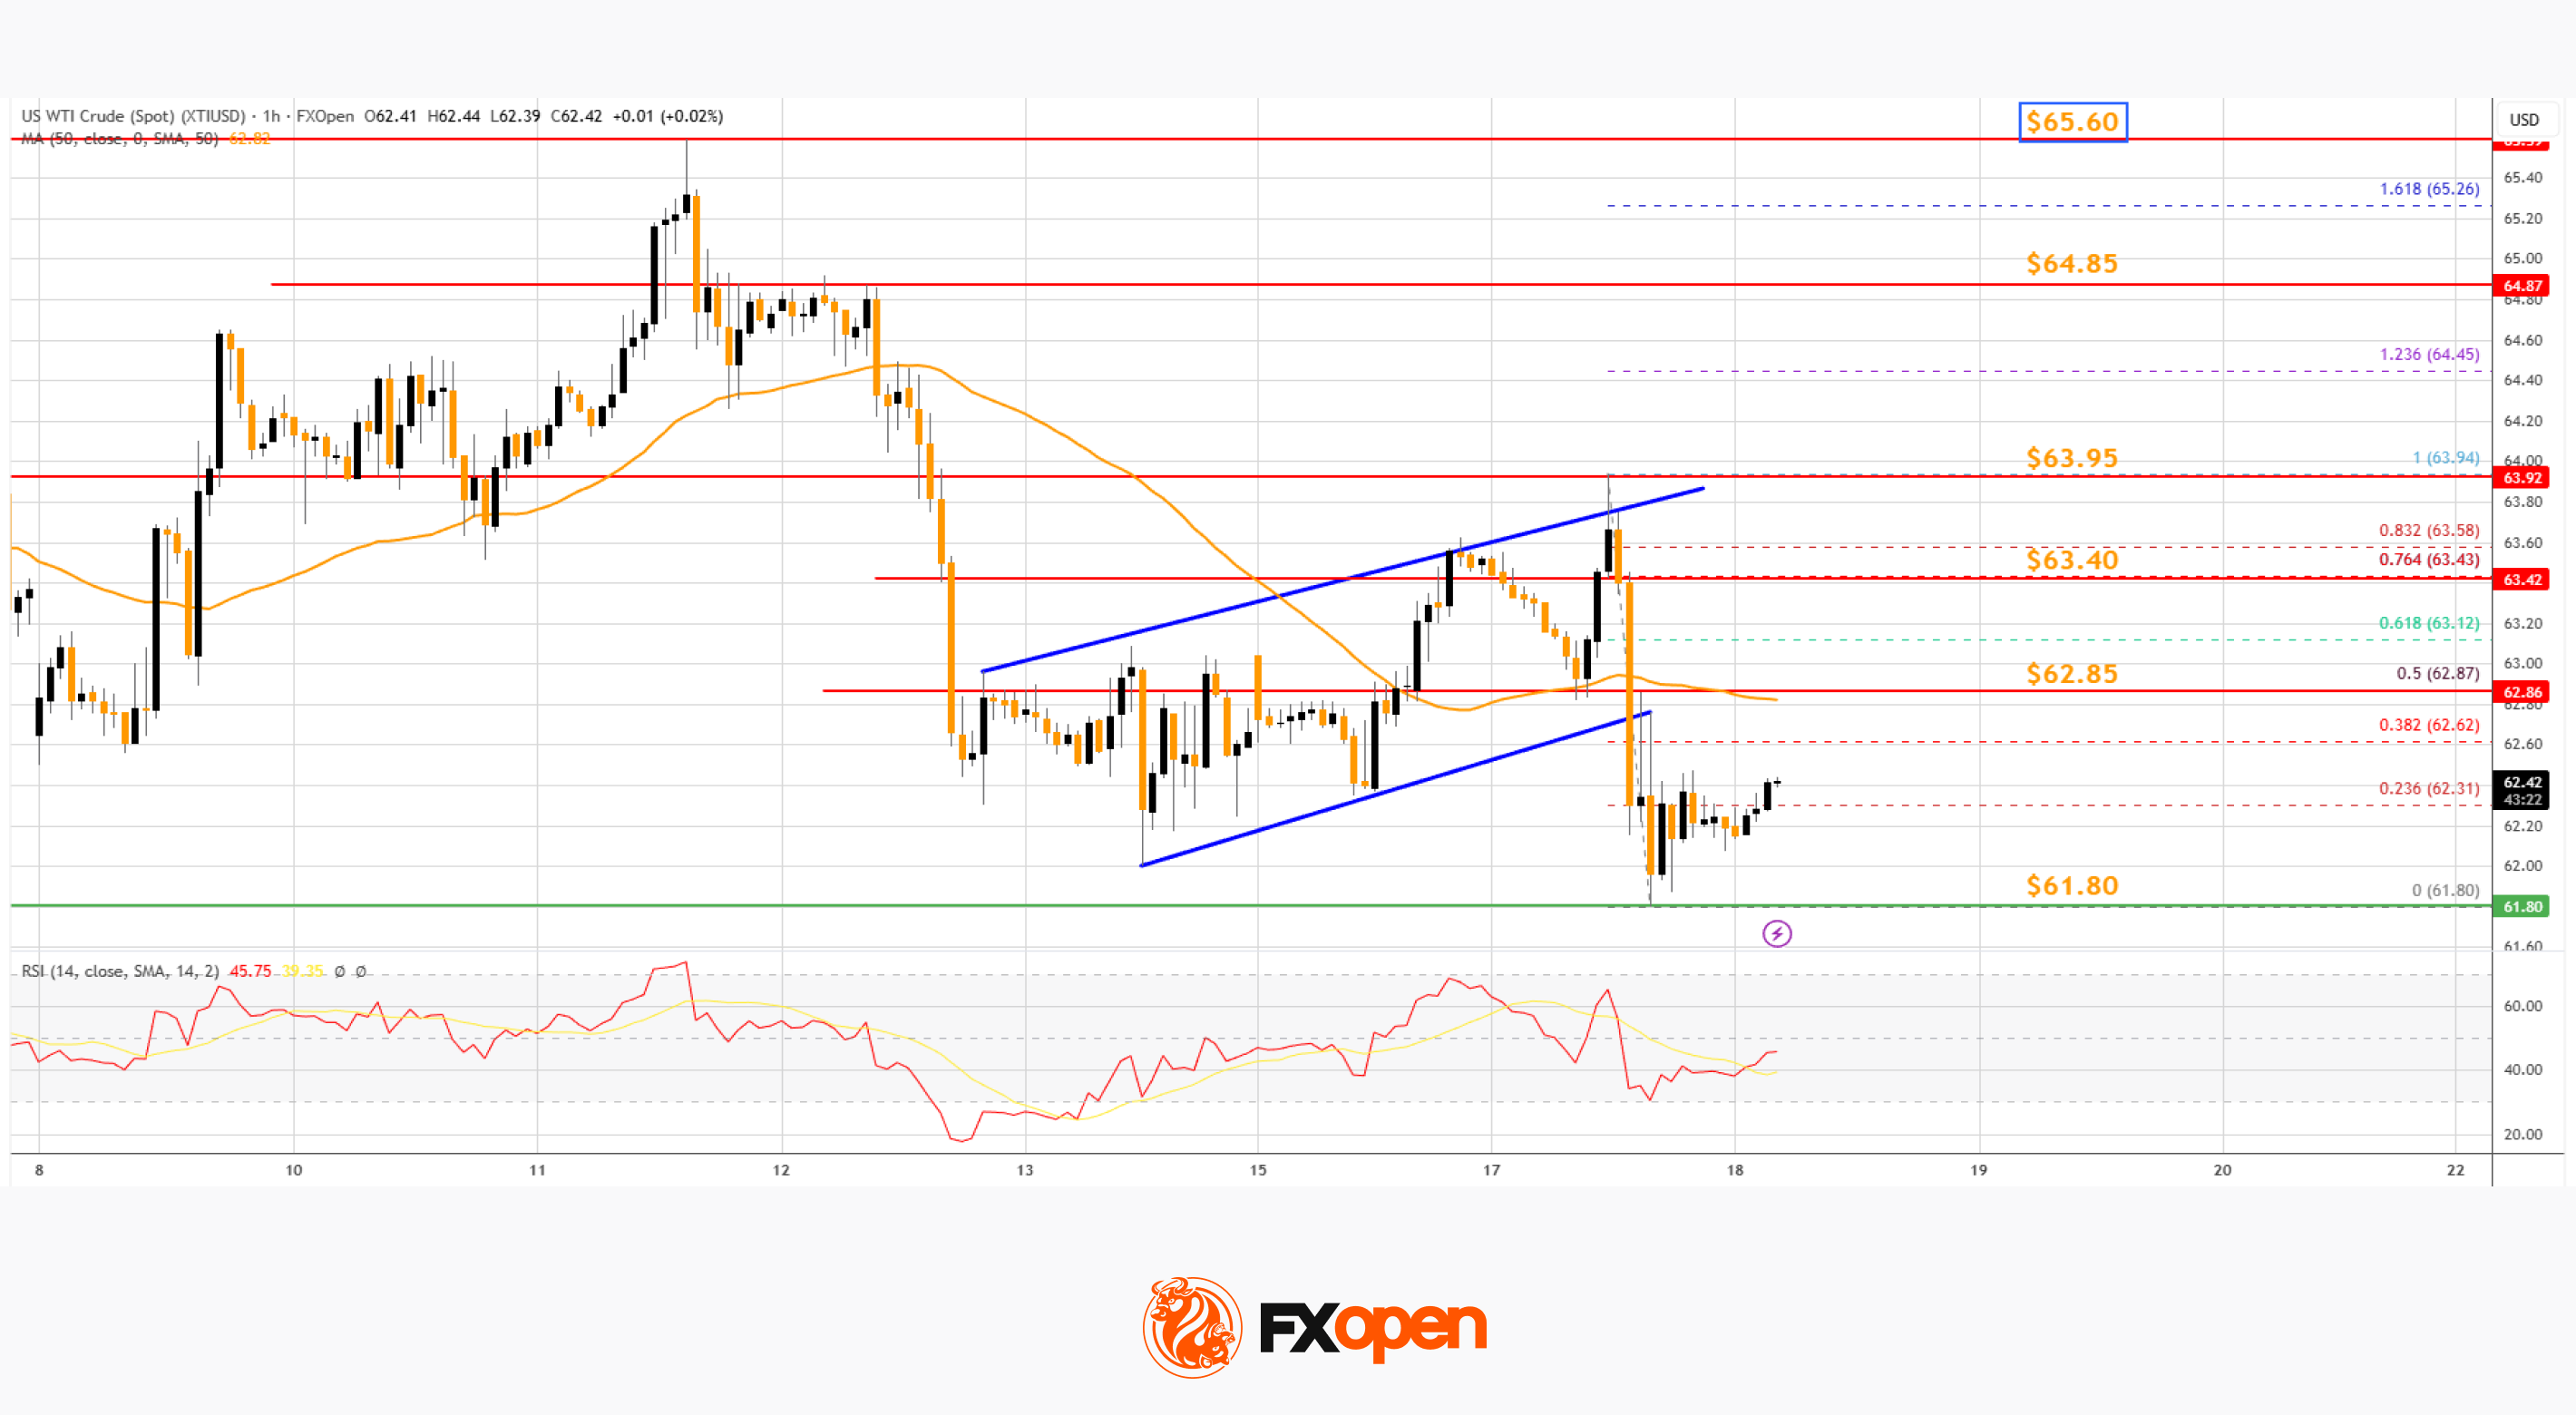
There was a move above the 23.6% Fib retracement level of the downward move from the $63.94 swing high to the $61.80 low. On the upside, immediate resistance is near the 50% Fib retracement at $62.85.
The main hurdle is $63.40. A clear move above $63.40 could send the price toward $63.95. The next stop for the bulls might be $64.85.
If the price climbs further, it could face sellers near $65.60. Immediate support is $61.80. The next major breakdown level on the WTI crude oil chartis $60.50. If there is a downside break, the price might decline toward $58.80. Any more losses may perhaps open the doors for a move toward $56.50.

