
Gold price started a fresh surge above $3,750 and traded to a new all-time high. Crude oil is recovering and might rise toward the $64.30 resistance zone.
· Gold price rallied to a new all-time high and traded close to $3,800 against the US Dollar.
· A short-term bullish flag pattern is forming with resistance at $3,770 on the hourly chart of gold at FXOpen.
· WTI Crude oil is recovering losses and trading above $62.60.
· There is a major bearish trend line in place with resistance near $63.65 on the hourly chart of XTI/USD at FXOpen.
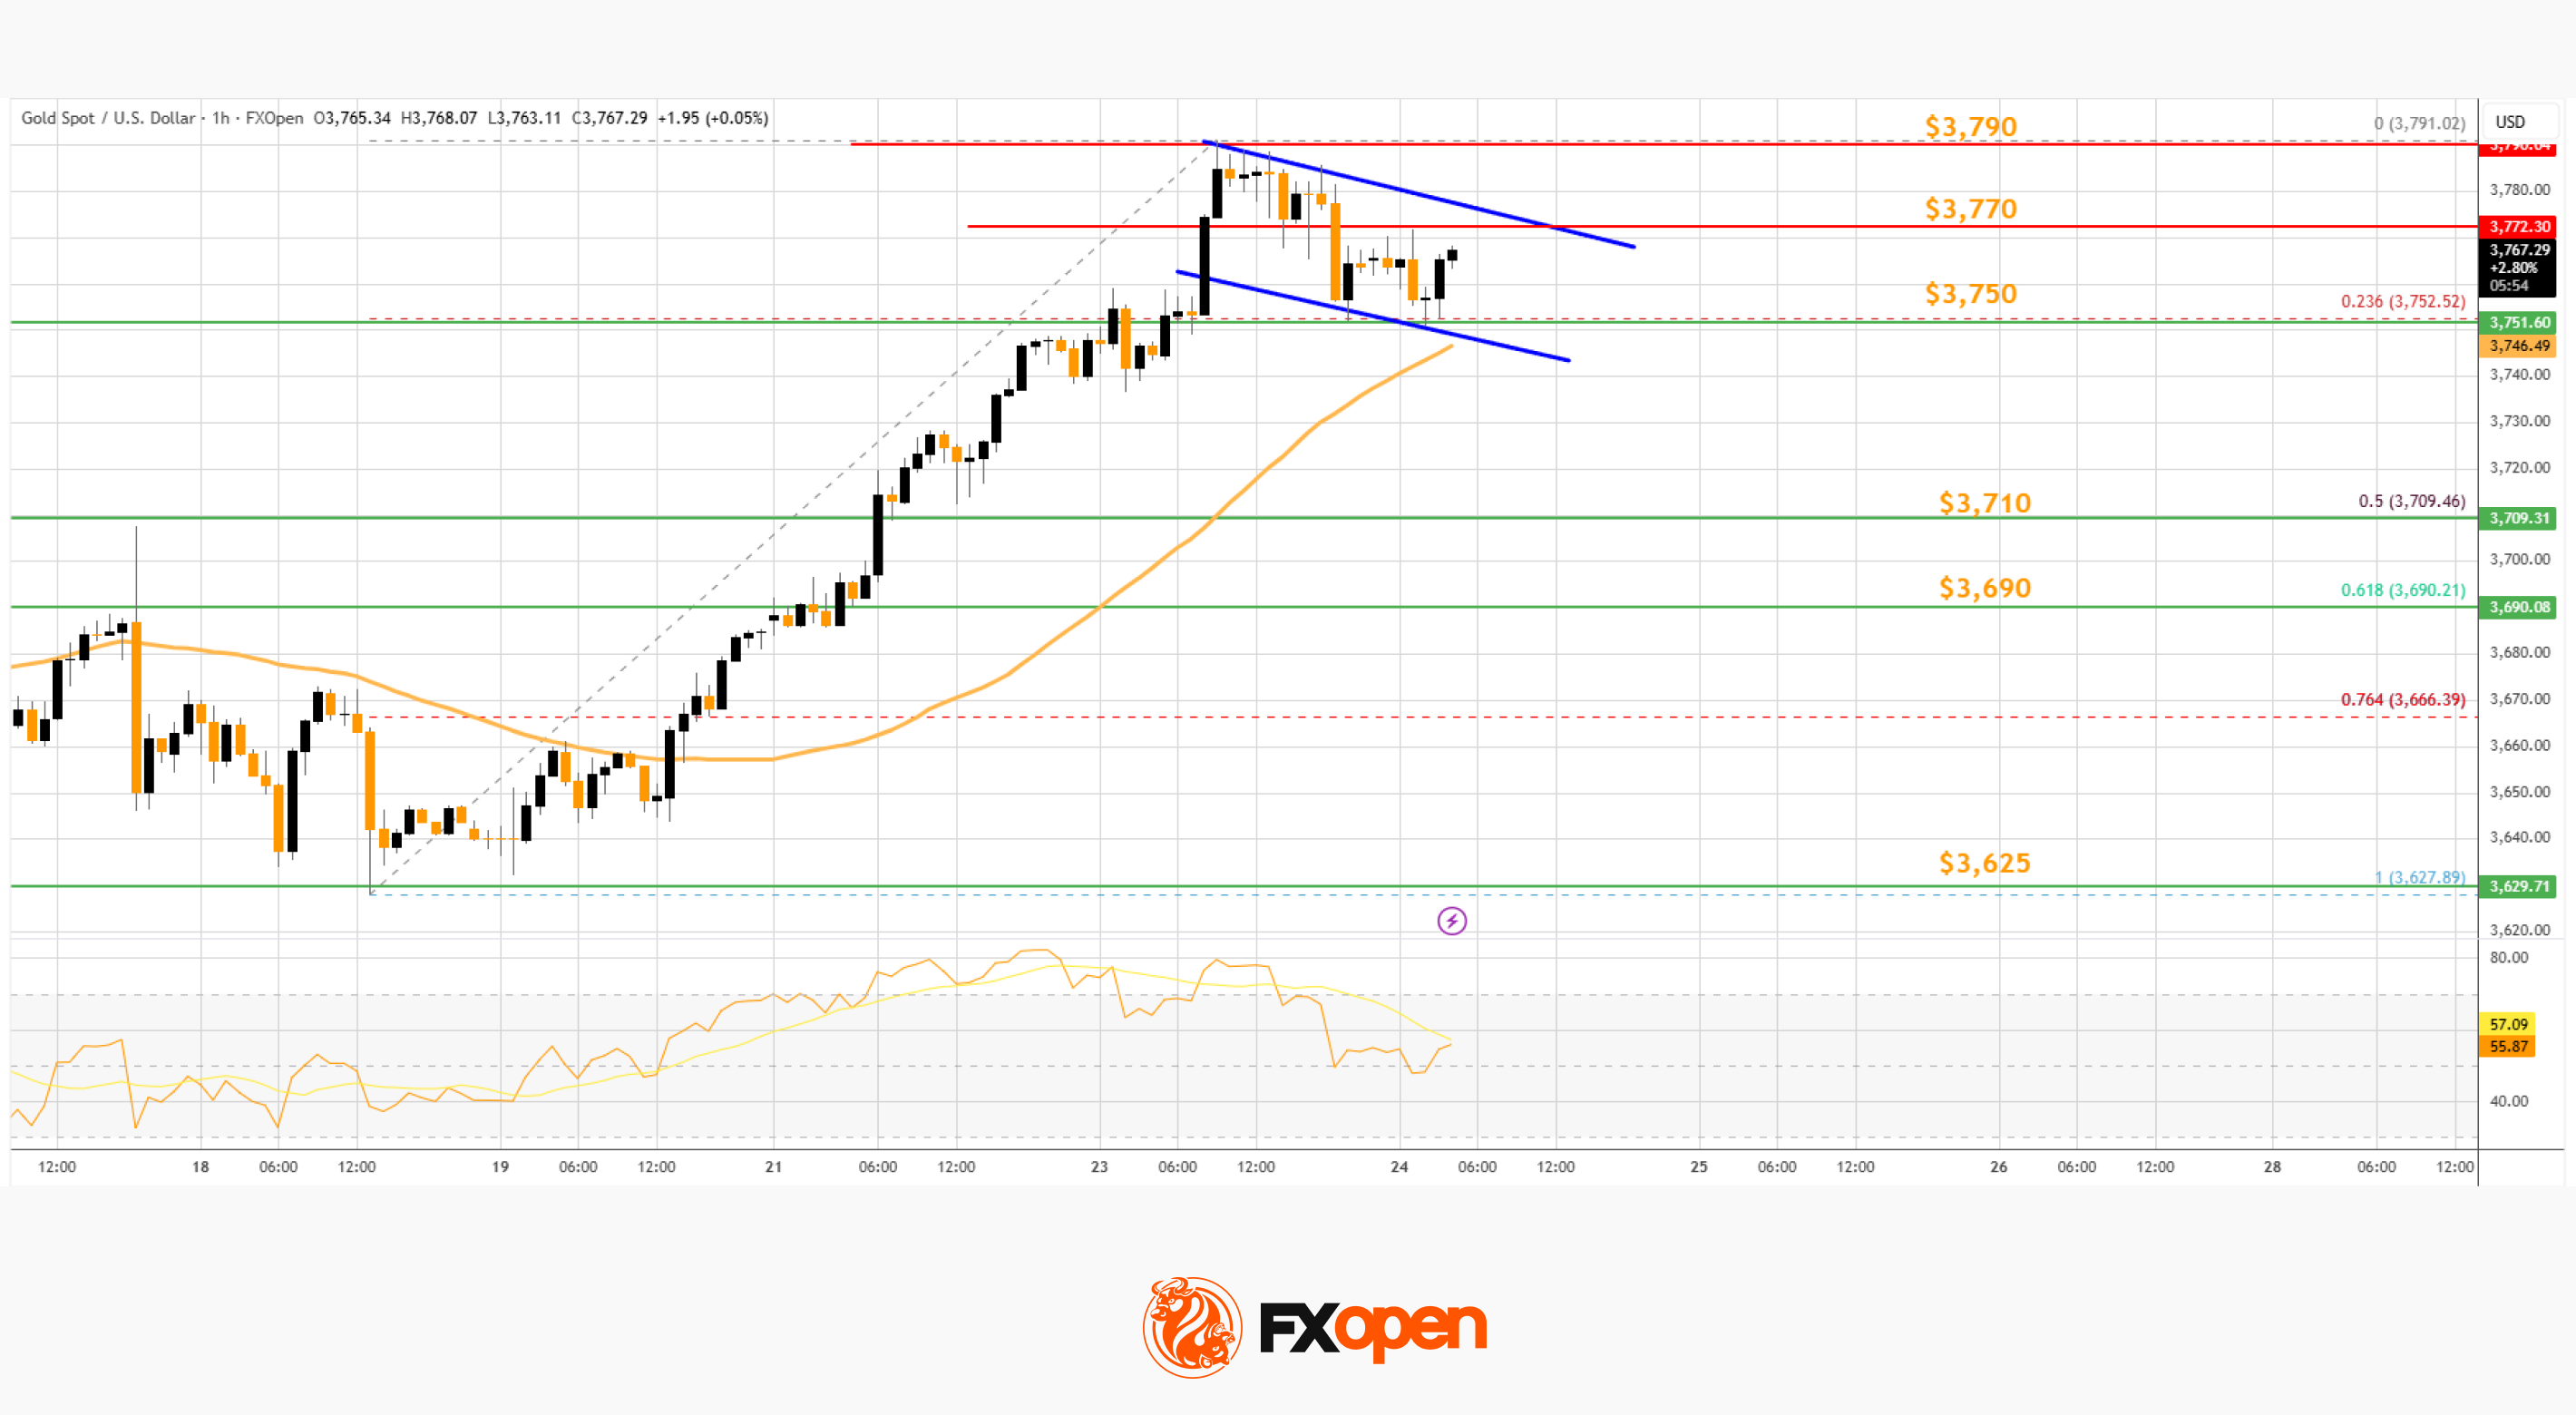
On the hourly chart of Gold at FXOpen, the price formed support near $3,625. The price remained in a bullish zone and started a fresh increase above $3,660, as mentioned in the previous analysis.
The bulls pushed the price above $3,750 level and the 50-hour simple moving average. Finally, it traded to a new all-time high at $3,791. The price is now consolidating gains below $3,770 and the RSI is above 50.
Initial support on the downside is near the 23.6% Fib retracement level of the upward move from the $3,627 swing low to the $3,791 high at $3,750 and the 50-hour simple moving average.
A downside break below $3,750 could start a larger downside correction. In the stated case, Gold could drop toward the 50% Fib retracement at $3,710. The next area of interest for the bulls might be $3,690. A daily close below $3,690 could spark bearish moves and send the price to $3,625.
If there is a fresh increase, the price could face resistance at $3,770 and a short-term bullish flag pattern. The next sell zone might be $3,790. An upside break above the $3,790 resistance could send Gold price toward $3,820. Any more gains may perhaps set the pace for an increase to $3,850.
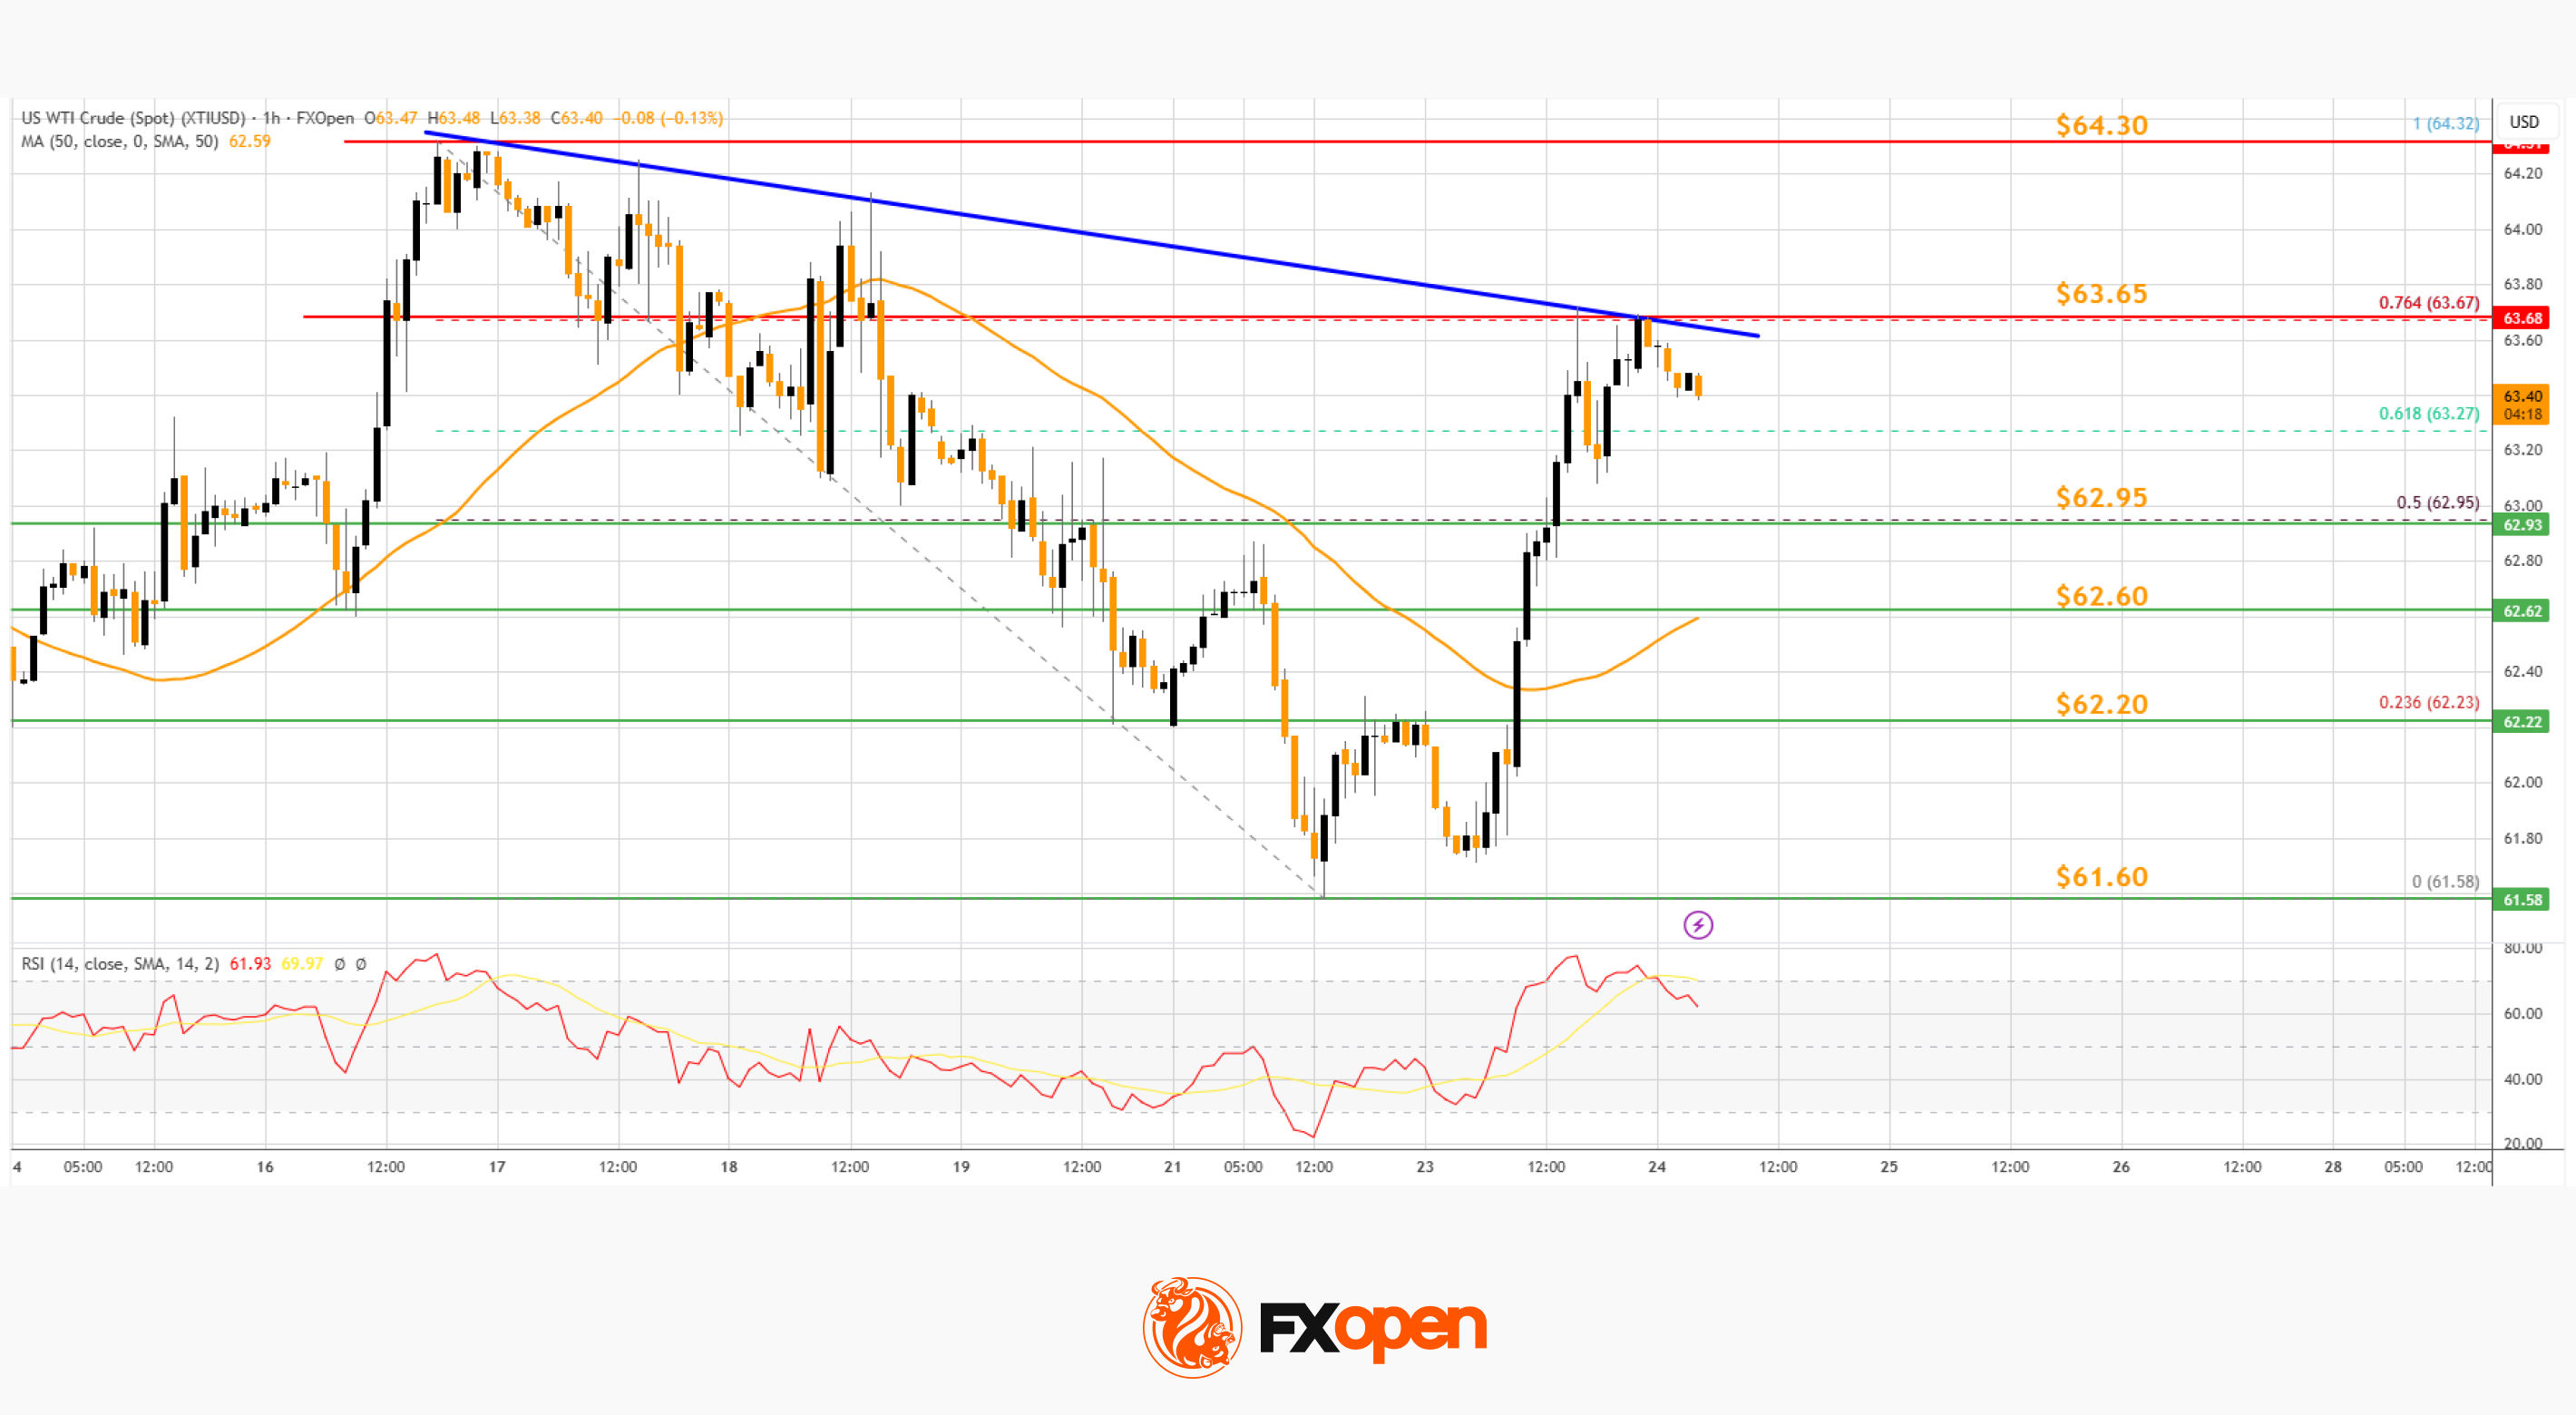
On the hourly chart of WTI Crude Oil at FXOpen, the price found support near $61.60 against the US Dollar. The price formed a base and started a recovery wave above $62.60 and the 50-hour simple moving average.
The bulls were able to push the price above the 50% Fib retracement level of the downward move from the $64.32 swing high to the $61.58 swing low. The hourly RSI is above the 60 level, but the price is struggling near $63.65.
Besides, there is a major bearish trend line in place with resistance near $63.65. It coincides with the 76.4% Fib retracement. A close above the trend line resistance might send the price toward the $64.32 high.
The next hurdle could be $65.00. A clear move above $65.00 could send the price toward $66.25. Any more gains might open the doors for a test of $68.00.
Conversely, the price might start a fresh decline from $63.65. Immediate support sits near $62.95. The key breakdown zone on the WTI crude oil chartmight be $62.60 and the 50-hour simple moving average.
If there is a downside break, the price might decline toward $62.60. Any more losses might encourage the bears for a push toward the $61.58 low.


